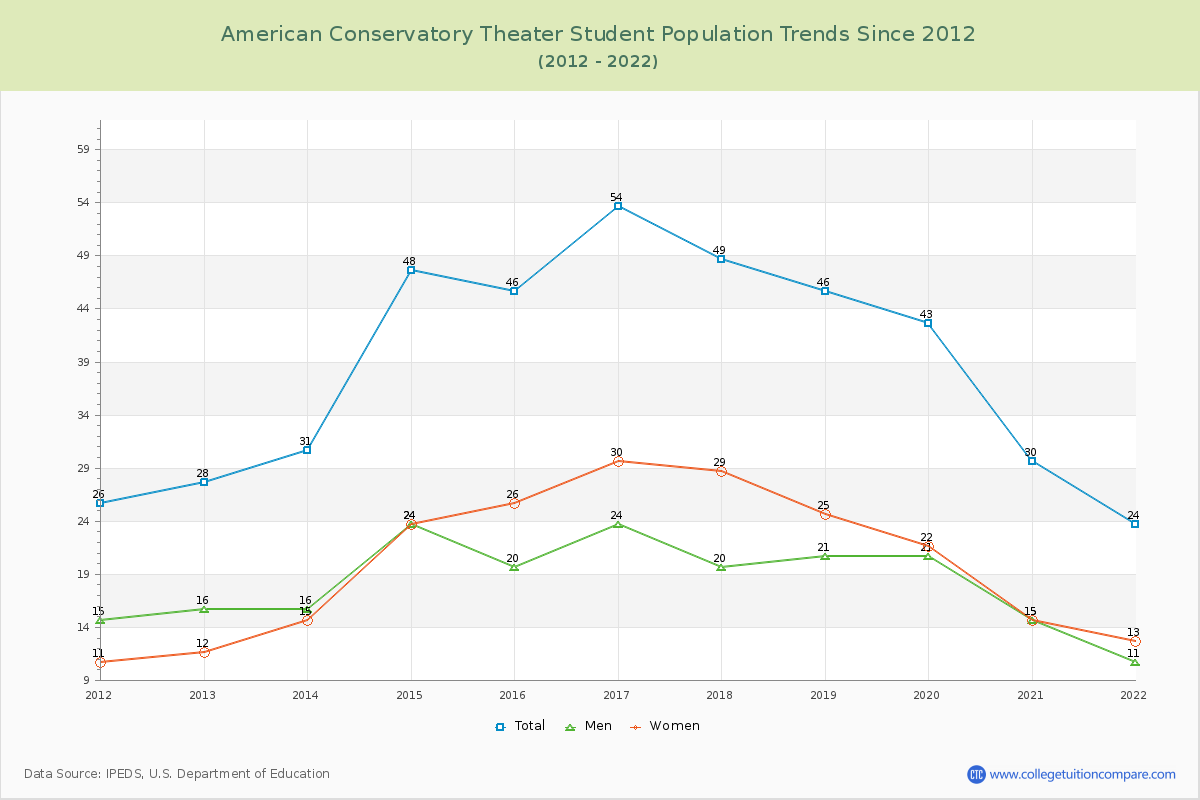
Student Population Changes
The average student population over the last 11 years is 40 where 24 students are attending the school for the academic year 2021-2022.
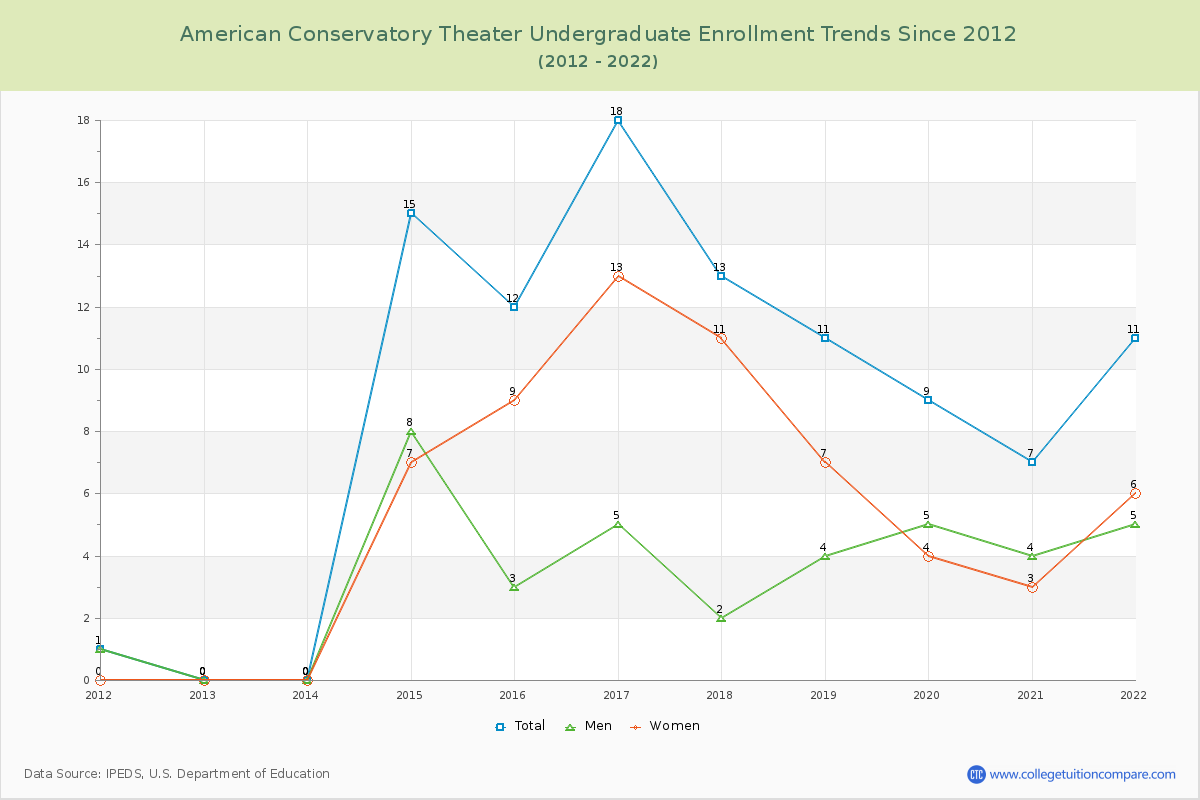
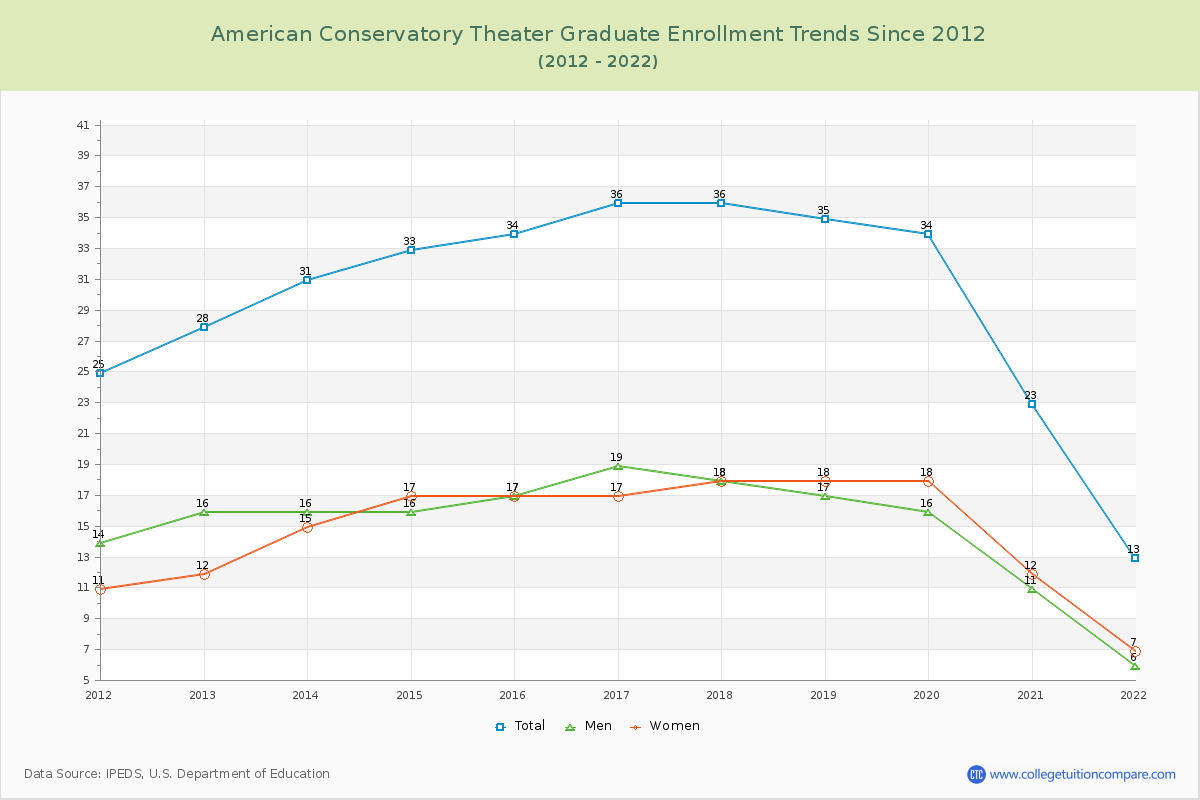
45.83% of total students is undergraduate students and 54.17% students is graduate students. The number of undergraduate students has increased by 11 and the graduate enrollment has decreased by 15 over past 10 years.
The female to male ratio is 1.18 to 1 and it means that there are slightly more female students enrolled in American Conservatory Theater than male students.
The following table and chart illustrate the changes in student population by gender at American Conservatory Theater since 2012.
| Year | Total | Undergraduate | Graduate | ||||
|---|---|---|---|---|---|---|---|
| Total | Men | Women | Total | Men | Women | ||
| 2012-13 | 28 | 0 | 0 | 0 | 28 | 16 | 12 |
| 2013-14 | 31 3 | 0 0 | 0 0 | 0 0 | 31 3 | 16 0 | 15 3 |
| 2014-15 | 48 17 | 15 15 | 8 8 | 7 7 | 33 2 | 16 0 | 17 2 |
| 2015-16 | 46 -2 | 12 -3 | 3 -5 | 9 2 | 34 1 | 17 1 | 17 0 |
| 2016-17 | 54 8 | 18 6 | 5 2 | 13 4 | 36 2 | 19 2 | 17 0 |
| 2017-18 | 49 -5 | 13 -5 | 2 -3 | 11 -2 | 36 0 | 18 -1 | 18 1 |
| 2018-19 | 46 -3 | 11 -2 | 4 2 | 7 -4 | 35 -1 | 17 -1 | 18 0 |
| 2019-20 | 43 -3 | 9 -2 | 5 1 | 4 -3 | 34 -1 | 16 -1 | 18 0 |
| 2020-21 | 30 -13 | 7 -2 | 4 -1 | 3 -1 | 23 -11 | 11 -5 | 12 -6 |
| 2021-22 | 24 -6 | 11 4 | 5 1 | 6 3 | 13 -10 | 6 -5 | 7 -5 |
| Average | 40 | 10 | 4 | 6 | 30 | 15 | 15 |