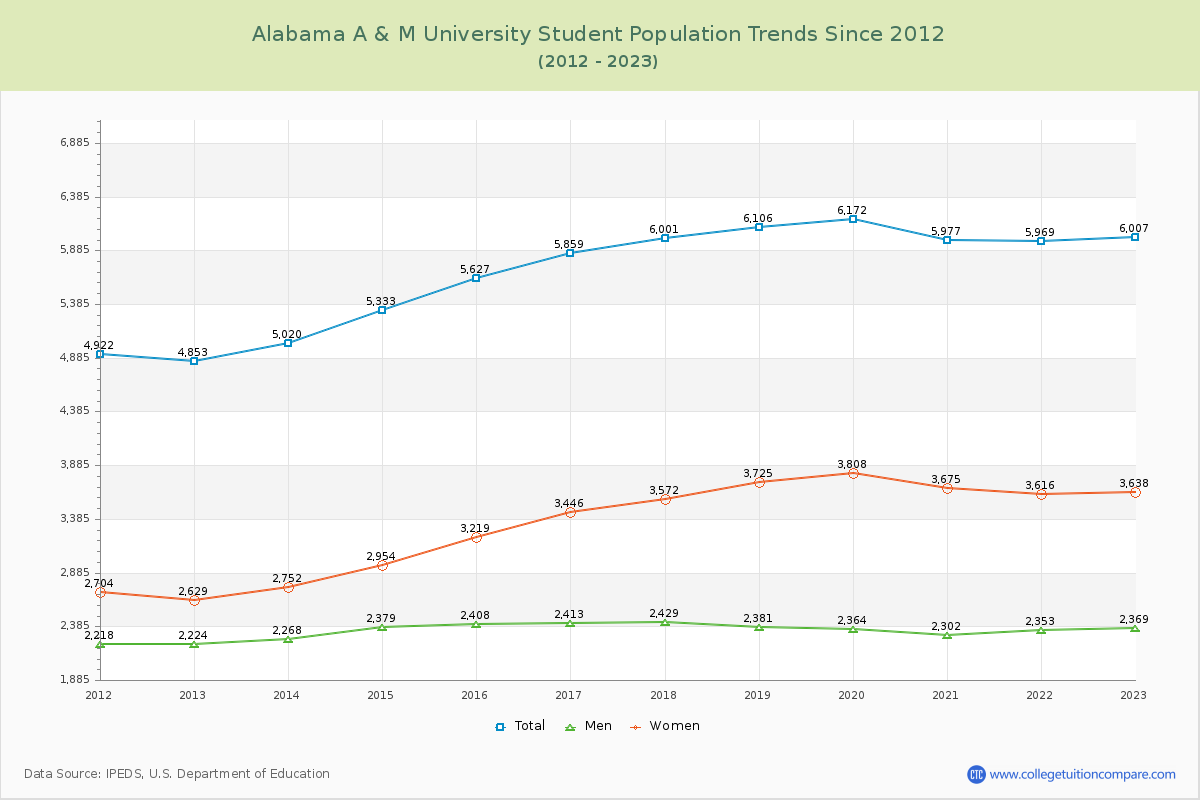
Student Population Changes
The average student population over the last 12 years is 5,720 where 6,007 students are attending the school for the academic year 2022-2023.
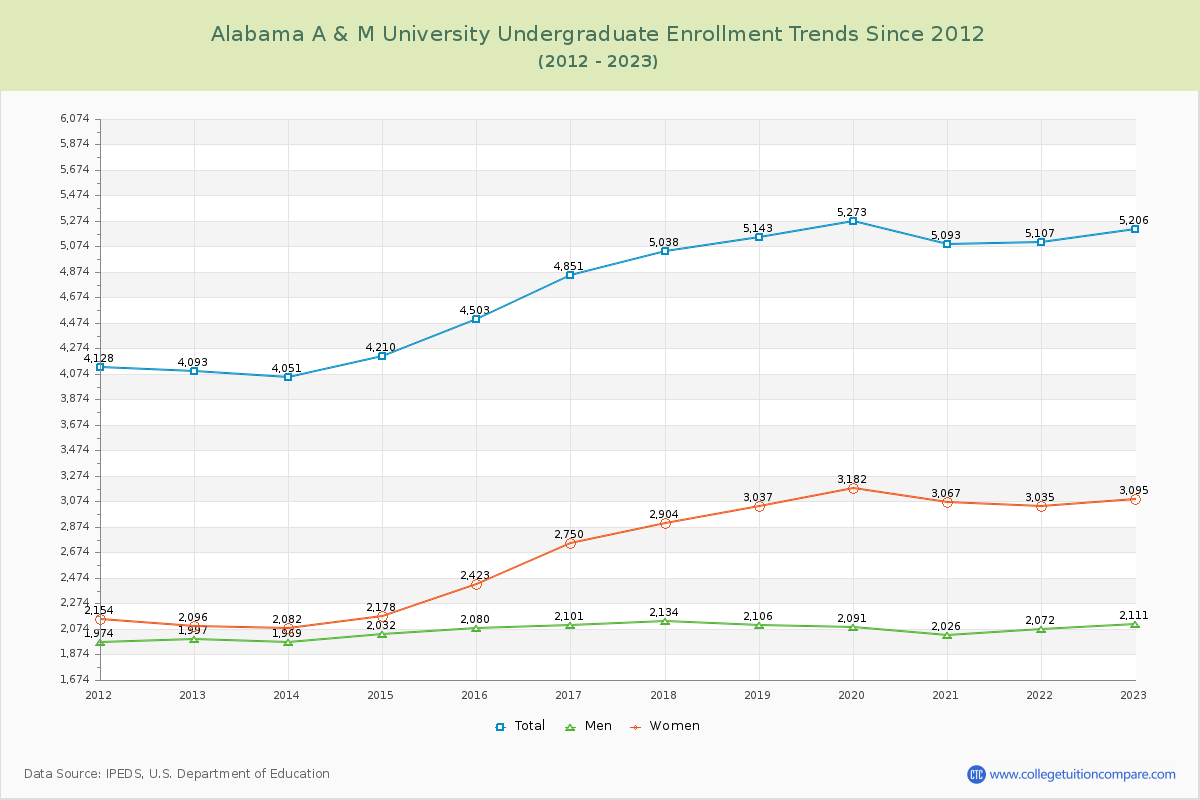
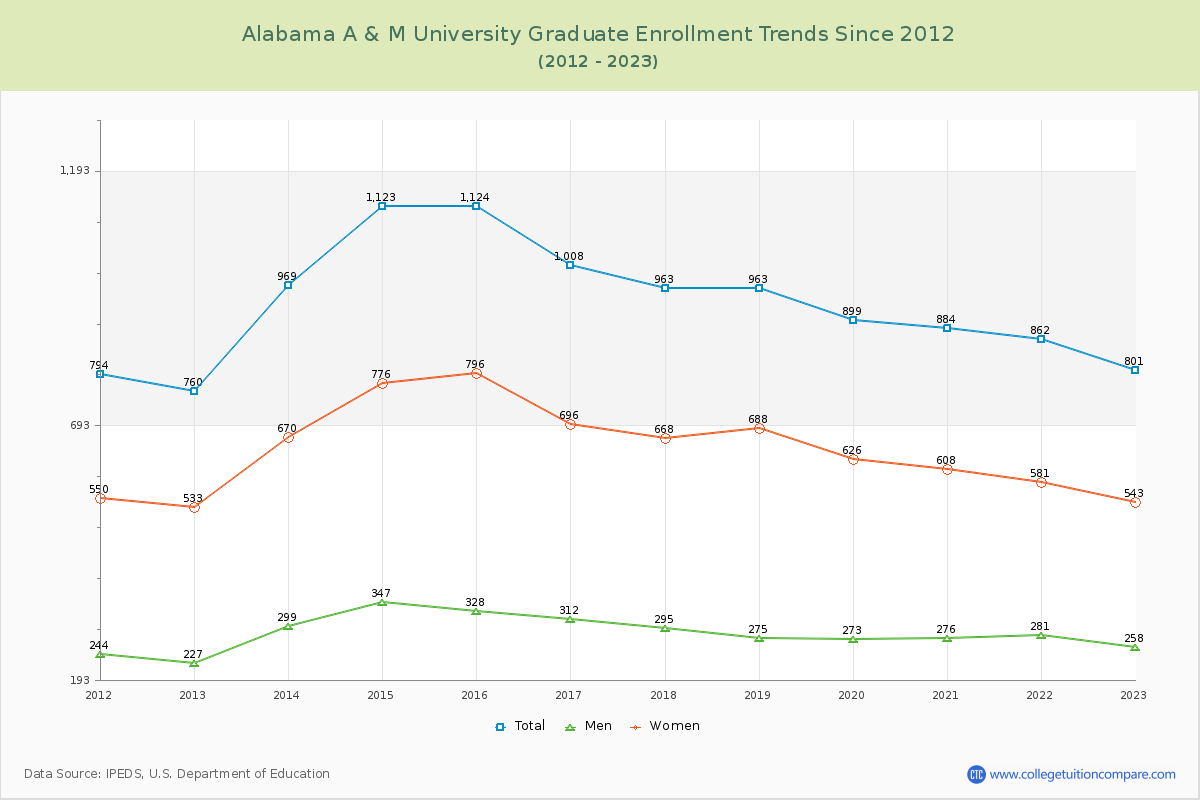
86.67% of total students is undergraduate students and 13.33% students is graduate students. The number of undergraduate students has increased by 1,113 and the graduate enrollment has increased by 41 over past 10 years.
The female to male ratio is 1.54 to 1 and it means that there are more female students enrolled in AAMU than male students.
The following table and chart illustrate the changes in student population by gender at Alabama A & M University since 2012.
| Year | Total | Undergraduate | Graduate | ||||
|---|---|---|---|---|---|---|---|
| Total | Men | Women | Total | Men | Women | ||
| 2012-13 | 4,853 | 4,093 | 1,997 | 2,096 | 760 | 227 | 533 |
| 2013-14 | 5,020 167 | 4,051 -42 | 1,969 -28 | 2,082 -14 | 969 209 | 299 72 | 670 137 |
| 2014-15 | 5,333 313 | 4,210 159 | 2,032 63 | 2,178 96 | 1,123 154 | 347 48 | 776 106 |
| 2015-16 | 5,627 294 | 4,503 293 | 2,080 48 | 2,423 245 | 1,124 1 | 328 -19 | 796 20 |
| 2016-17 | 5,859 232 | 4,851 348 | 2,101 21 | 2,750 327 | 1,008 -116 | 312 -16 | 696 -100 |
| 2017-18 | 6,001 142 | 5,038 187 | 2,134 33 | 2,904 154 | 963 -45 | 295 -17 | 668 -28 |
| 2018-19 | 6,106 105 | 5,143 105 | 2,106 -28 | 3,037 133 | 963 0 | 275 -20 | 688 20 |
| 2019-20 | 6,172 66 | 5,273 130 | 2,091 -15 | 3,182 145 | 899 -64 | 273 -2 | 626 -62 |
| 2020-21 | 5,977 -195 | 5,093 -180 | 2,026 -65 | 3,067 -115 | 884 -15 | 276 3 | 608 -18 |
| 2021-22 | 5,969 -8 | 5,107 14 | 2,072 46 | 3,035 -32 | 862 -22 | 281 5 | 581 -27 |
| 2022-23 | 6,007 38 | 5,206 99 | 2,111 39 | 3,095 60 | 801 -61 | 258 -23 | 543 -38 |
| Average | 5,720 | 4,779 | 2,065 | 2,714 | 941 | 288 | 653 |