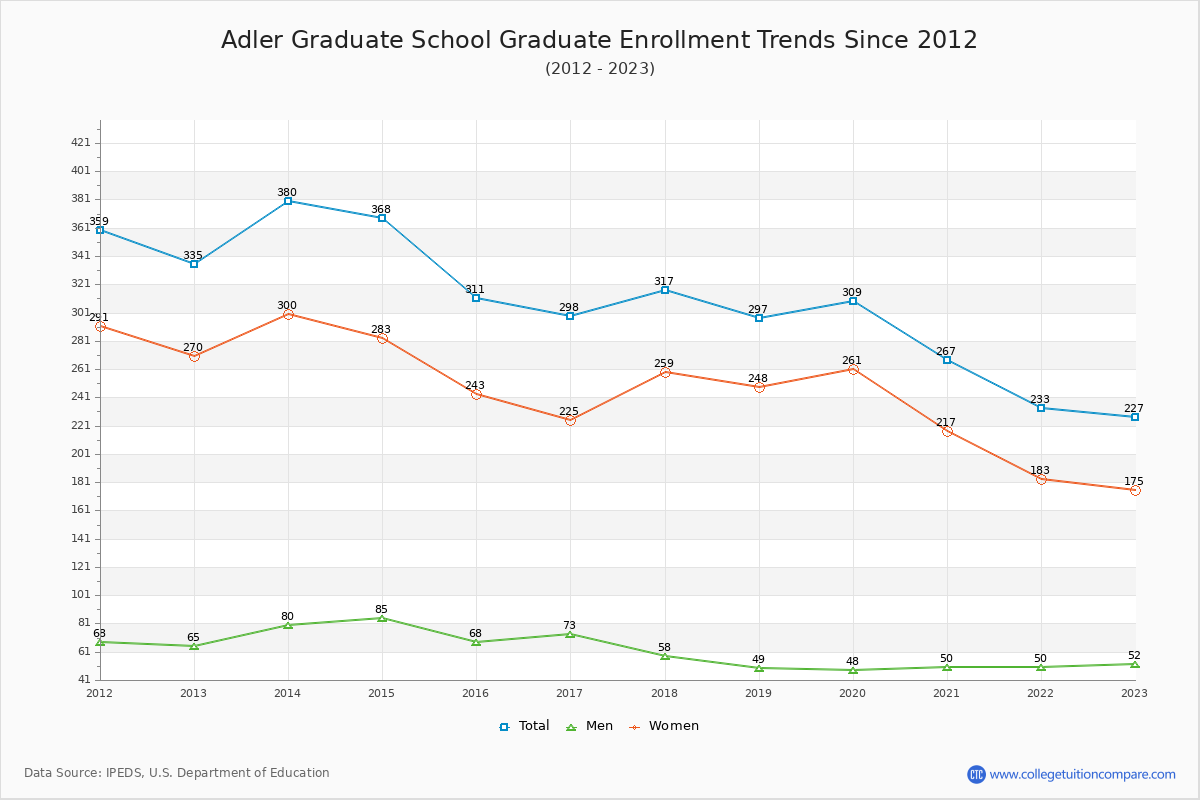
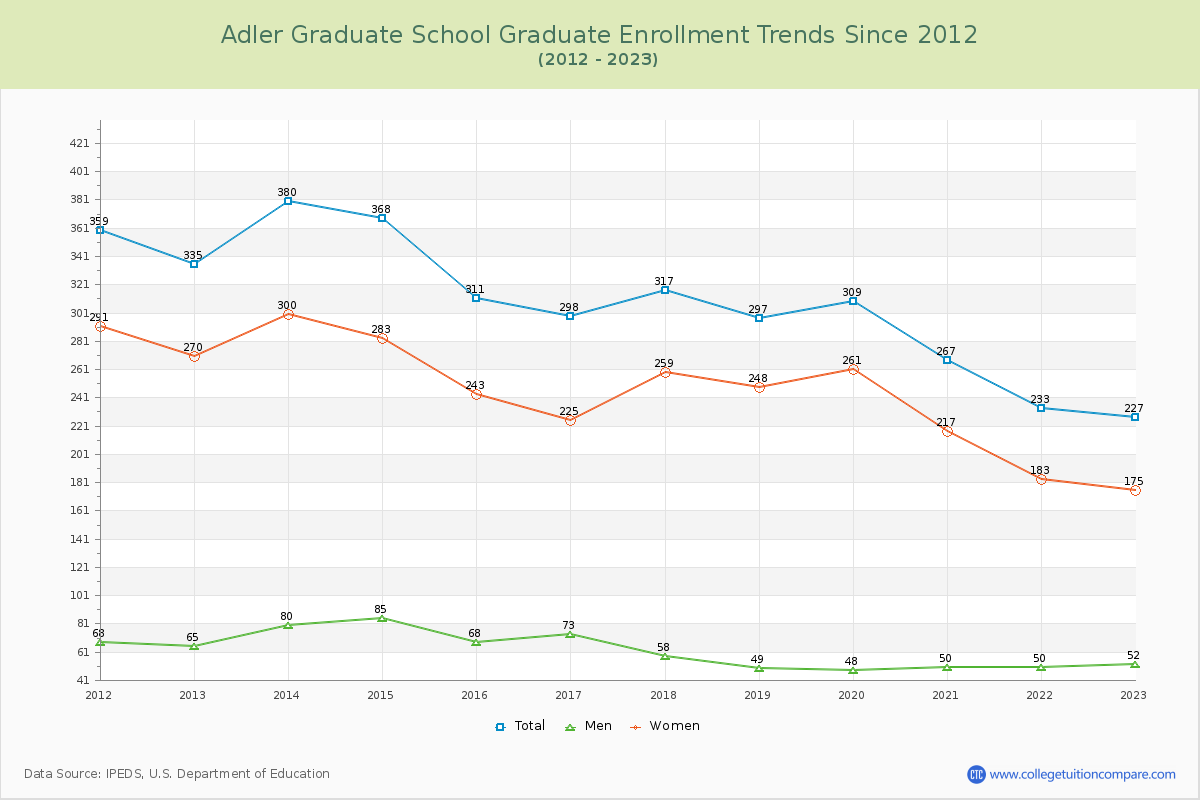
Student Population Changes
The average student population over the last 12 years is 304 where 227 students are attending the school for the academic year 2022-2023.
The female to male ratio is 3.37 to 1 and it means that there are far more female students enrolled in Adler Graduate School than male students.
The following table and chart illustrate the changes in student population by gender at Adler Graduate School since 2012.
| Year | Total | Men | Women |
|---|---|---|---|
| 2012-13 | 335 | 65 | 270 |
| 2013-14 | 380 45 | 80 15 | 300 30 |
| 2014-15 | 368 -12 | 85 5 | 283 -17 |
| 2015-16 | 311 -57 | 68 -17 | 243 -40 |
| 2016-17 | 298 -13 | 73 5 | 225 -18 |
| 2017-18 | 317 19 | 58 -15 | 259 34 |
| 2018-19 | 297 -20 | 49 -9 | 248 -11 |
| 2019-20 | 309 12 | 48 -1 | 261 13 |
| 2020-21 | 267 -42 | 50 2 | 217 -44 |
| 2021-22 | 233 -34 | 50 0 | 183 -34 |
| 2022-23 | 227 -6 | 52 2 | 175 -8 |
| Average | 304 | 62 | 242 |