Graduation Rates in Reasonable Completion Time
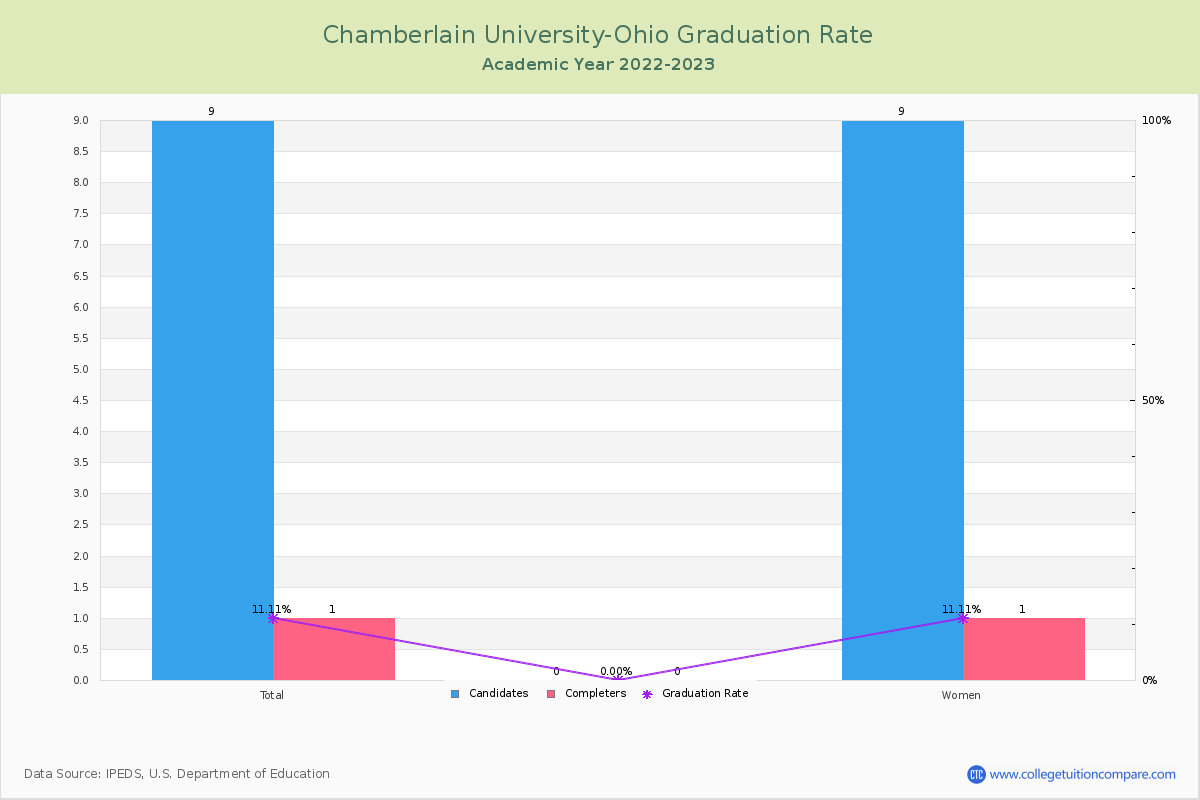
For the academic year 2022-2023, 1 students out of 9 candidates have completed their courses within 150% normal time (i.e. in 6 years for 4-year BS degree) at Chamberlain University-Ohio.
By gender, 0 male and 1 female students graduated the school last year completing their jobs in the period. Its graduation rate is much lower than the average rate when comparing similar colleges' rate of 59.76% (private (for-profit) health professions school).
| Candidates | Completers | Graduation Rates | |
|---|---|---|---|
| Total | 9 | 1 | 11.11% |
| Men | 0 | 0 | - |
| Women | 9 | 1 | 11.11% |
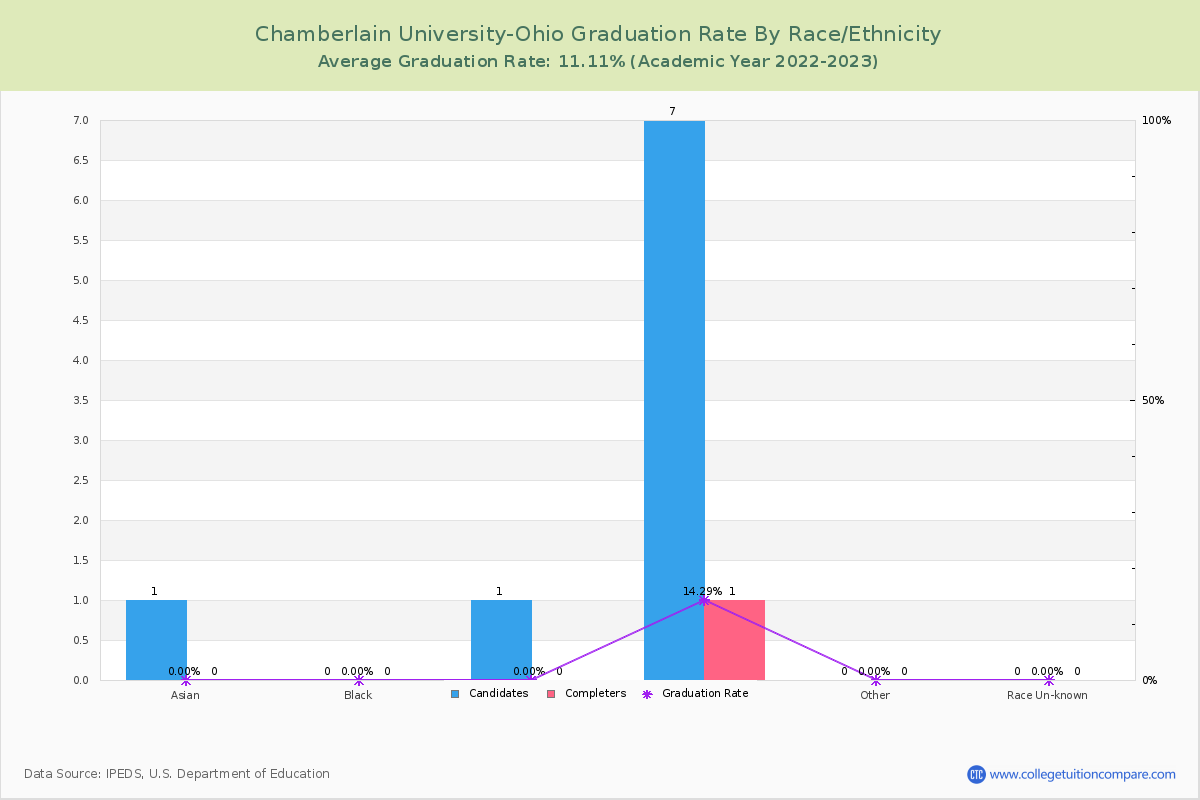
Graduation Rate By Race/Ethnicity
The following table shows graduation rate by race and at Chamberlain University-Ohio.
- Asian: 0.00%
- Hispanic: 0.00%
- White: 14.29%
| Total | Male | Female | |
|---|---|---|---|
| Asian | 0.00%(-/1) | - | - |
| Hispanic | 0.00%(-/1) | - | - |
| White | 14.29%(1/7) | - | 14.29%(1/7) |
Transfer-out and Retention Rates
At Chamberlain University-Ohio, the transfer-out rate is 66.67%. Its transfer-out rate is much higher than the average rate when comparing similar colleges' rate of 24.04%.
Chamberlain University-Ohio's retention rate is 100% last year. Its retention rate is higher than the average rate when comparing similar colleges' rate of 71.84%.