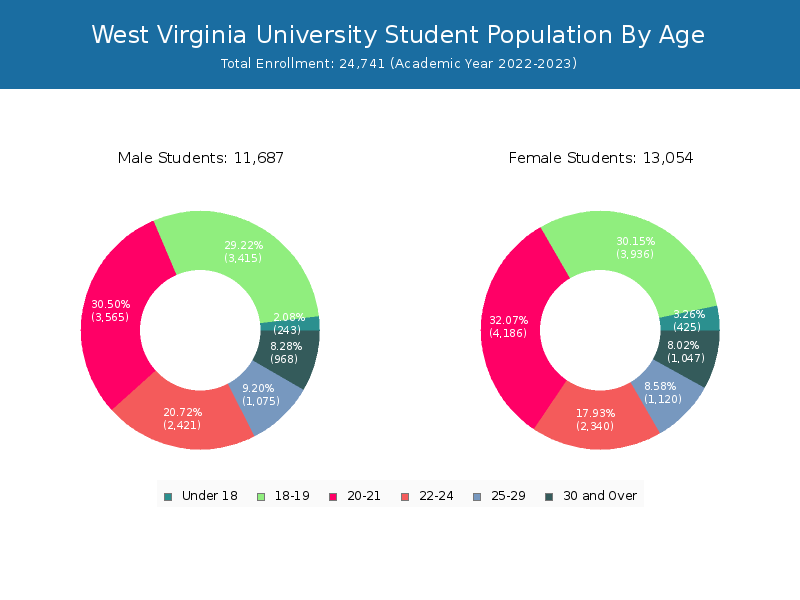
Student Population by Gender
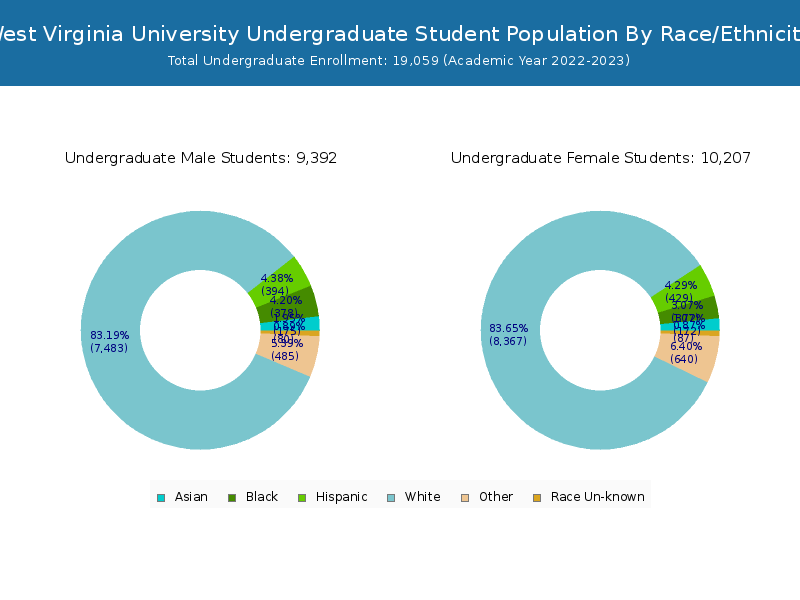
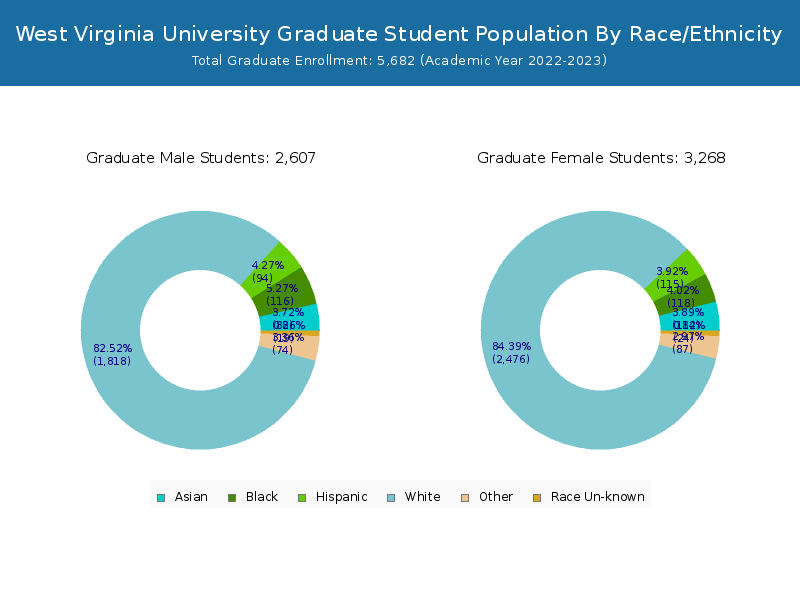
West Virginia University has a total of 24,741 enrolled students for the academic year 2022-2023. 19,059 students have enrolled in undergraduate programs and 5,682 students joined graduate programs.
By gender, 11,687 male and 13,054 female students (the male-female ratio is 47:53) are attending the school. The gender distribution is based on the 2022-2023 data.
| Total | Undergraduate | Graduate | |
|---|---|---|---|
| Total | 24,741 | 19,059 | 5,682 |
| Men | 11,687 | 9,179 | 2,508 |
| Women | 13,054 | 9,880 | 3,174 |
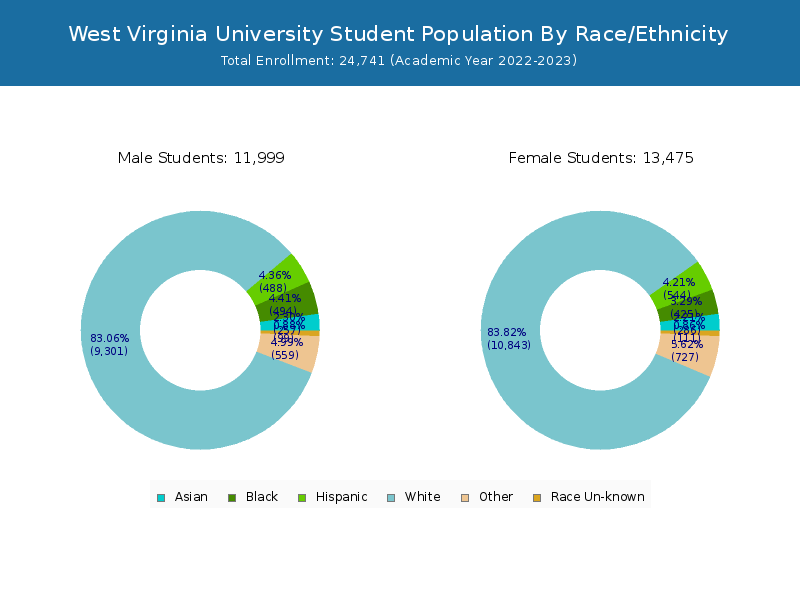
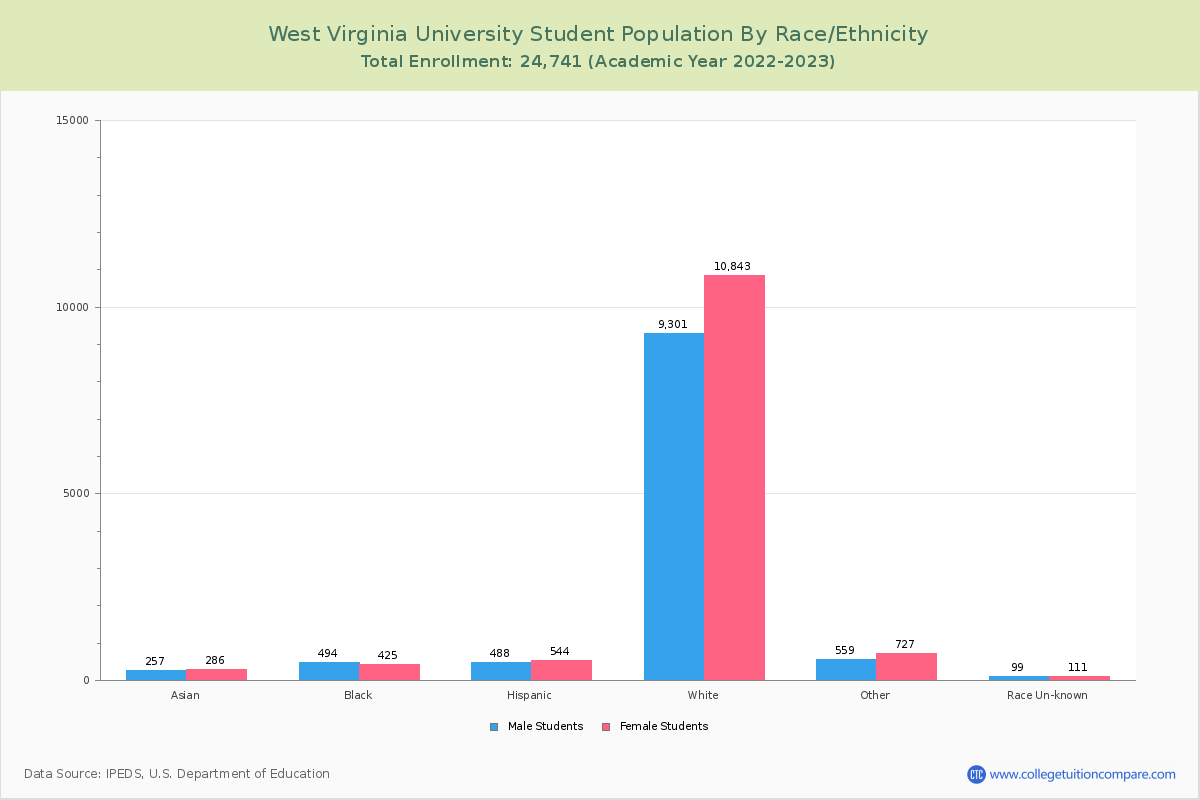
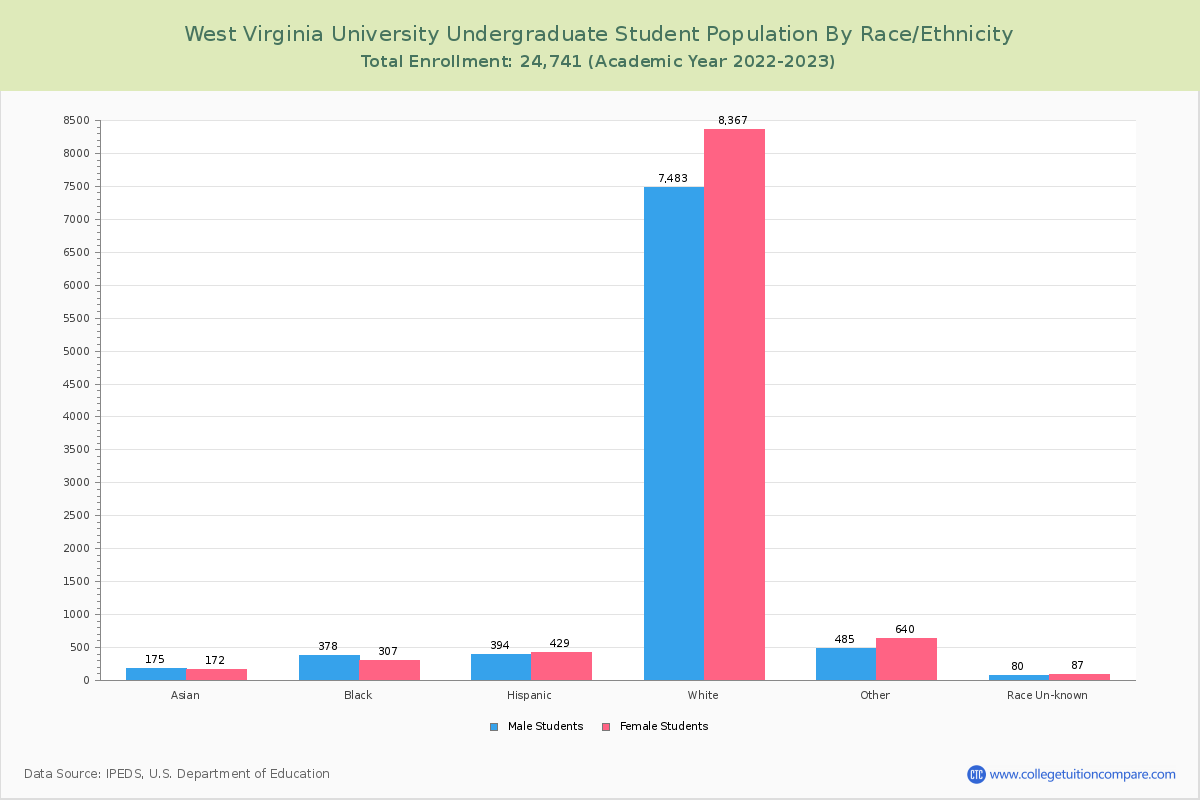
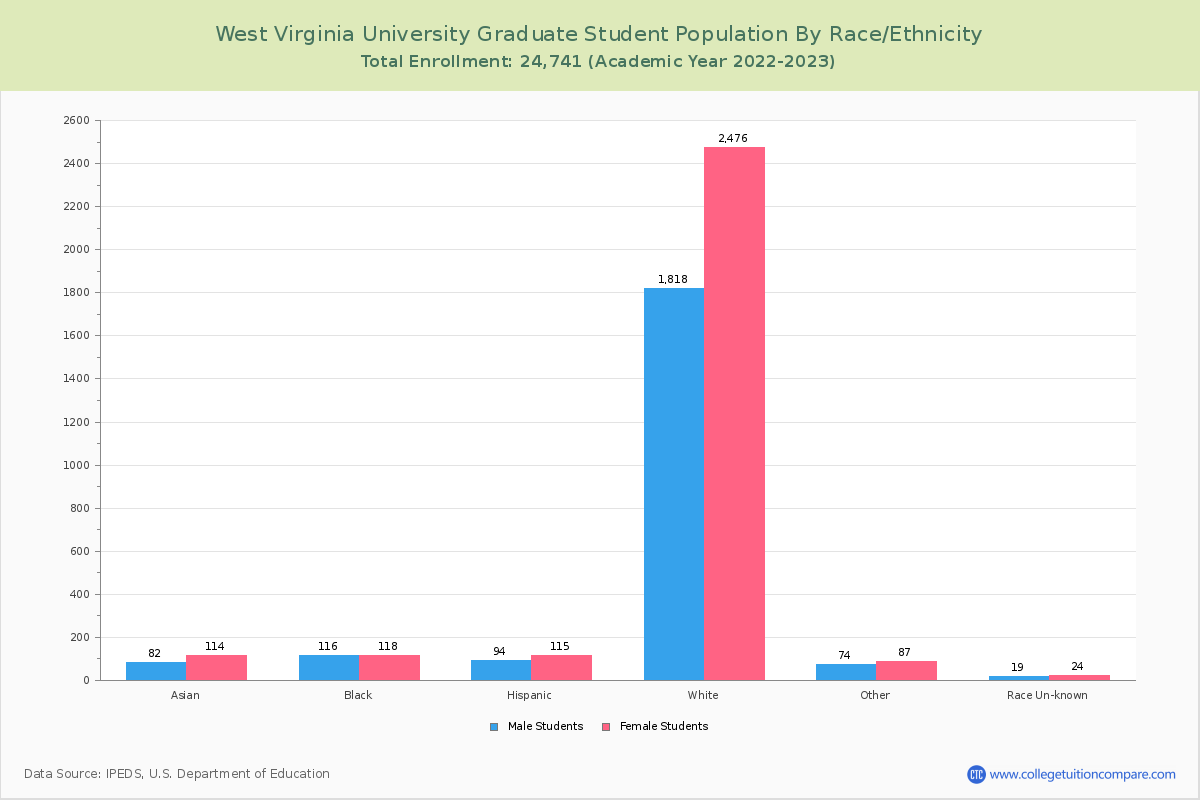
Student Distribution by Race/Ethnicity
By race/ethnicity, 19,625 White, 835 Black, and 503 Asian students out of a total of 24,741 are attending at West Virginia University. Comprehensive enrollment statistic data by race/ethnicity is shown in the next chart (Academic year 2022-2023 data).
| Race | Total | Men | Women |
|---|---|---|---|
| American Indian or Native American | 30 | 11 | 19 |
| Asian | 503 | 249 | 254 |
| Black | 835 | 463 | 372 |
| Hispanic | 1,009 | 469 | 540 |
| Native Hawaiian or Other Pacific Islanders | 14 | 11 | 3 |
| White | 19,625 | 9,136 | 10,489 |
| Two or more races | 1,229 | 525 | 704 |
| Race Unknown | 301 | 148 | 153 |
| Race | Total | Men | Women |
|---|---|---|---|
| American Indian or Native American | 26 | 8 | 18 |
| Asian | 325 | 172 | 153 |
| Black | 601 | 359 | 242 |
| Hispanic | 805 | 374 | 431 |
| Native Hawaiian or Other Pacific Islanders | 12 | 9 | 3 |
| White | 15,527 | 7,397 | 8,130 |
| Two or more races | 1,067 | 461 | 606 |
| Race Unknown | 248 | 127 | 121 |
| Race | Total | Men | Women |
|---|---|---|---|
| American Indian or Native American | 0 | 0 | 0 |
| Asian | 12 | 8 | 4 |
| Black | 40 | 28 | 12 |
| Hispanic | 36 | 23 | 13 |
| Native Hawaiian or Other Pacific Islanders | 0 | 0 | 0 |
| White | 500 | 246 | 254 |
| Two or more races | 41 | 23 | 18 |
| Race Unknown | 8 | 4 | 4 |
Student Age Distribution
By age, West Virginia has 668 students under 18 years old and 15 students over 65 years old. There are 20,531 students under 25 years old, and 4,210 students over 25 years old out of 24,741 total students.
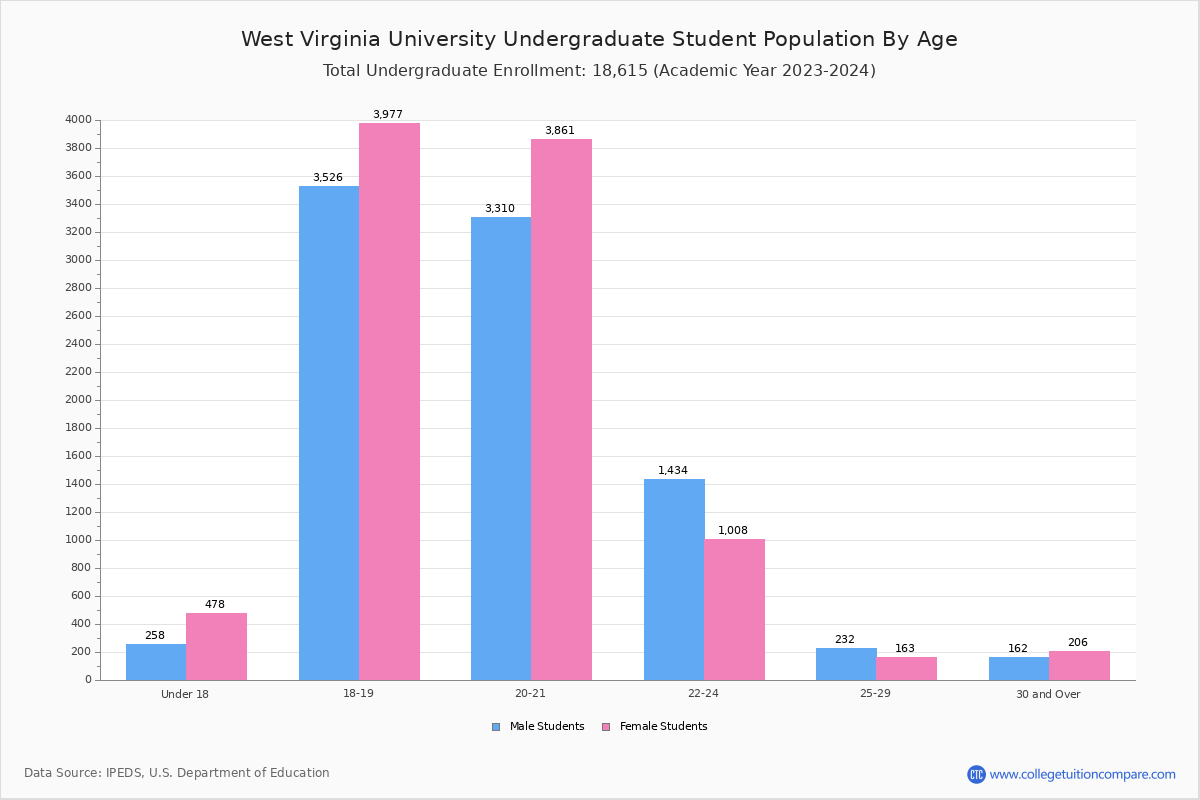
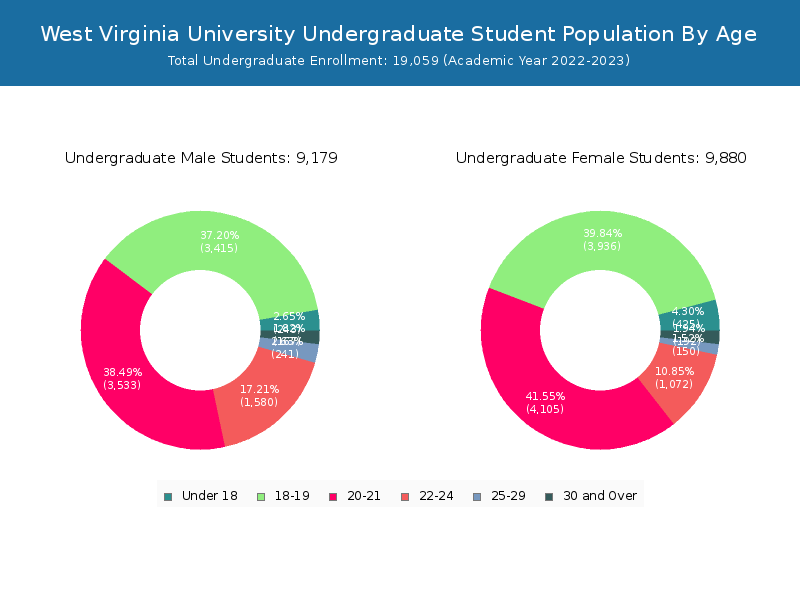
In undergraduate programs, 668 students are younger than 18 and 3 students are older than 65. West Virginia has 18,309 undergraduate students aged under 25 and 750 students aged 25 and over.
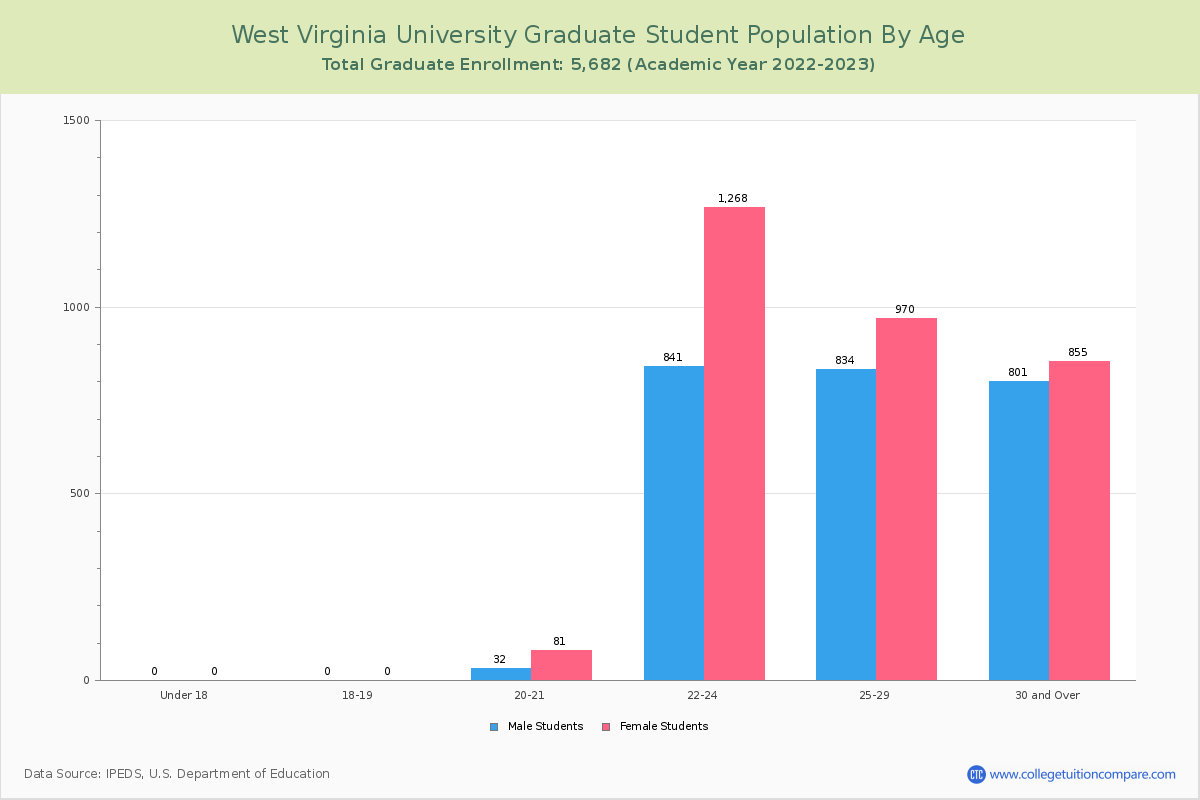
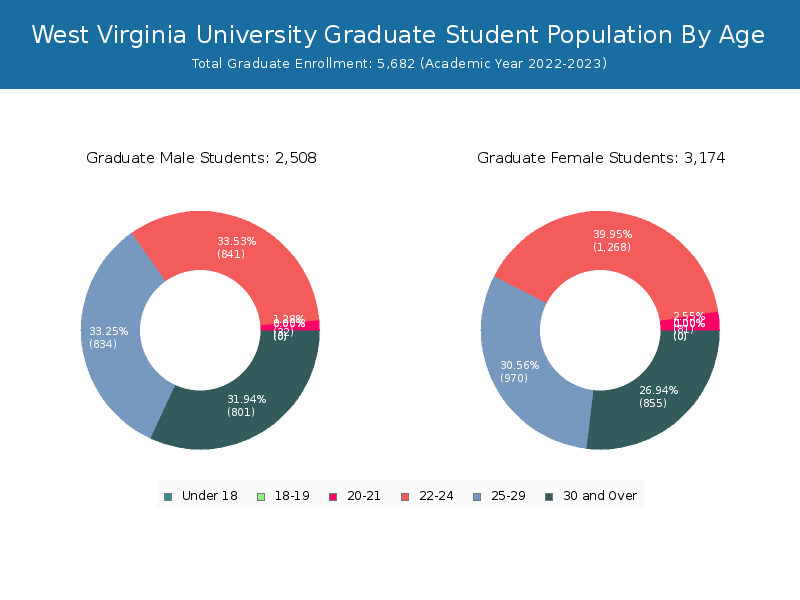
It has 2,222 graduate students aged under 25 and 3,460 students aged 25 and over.
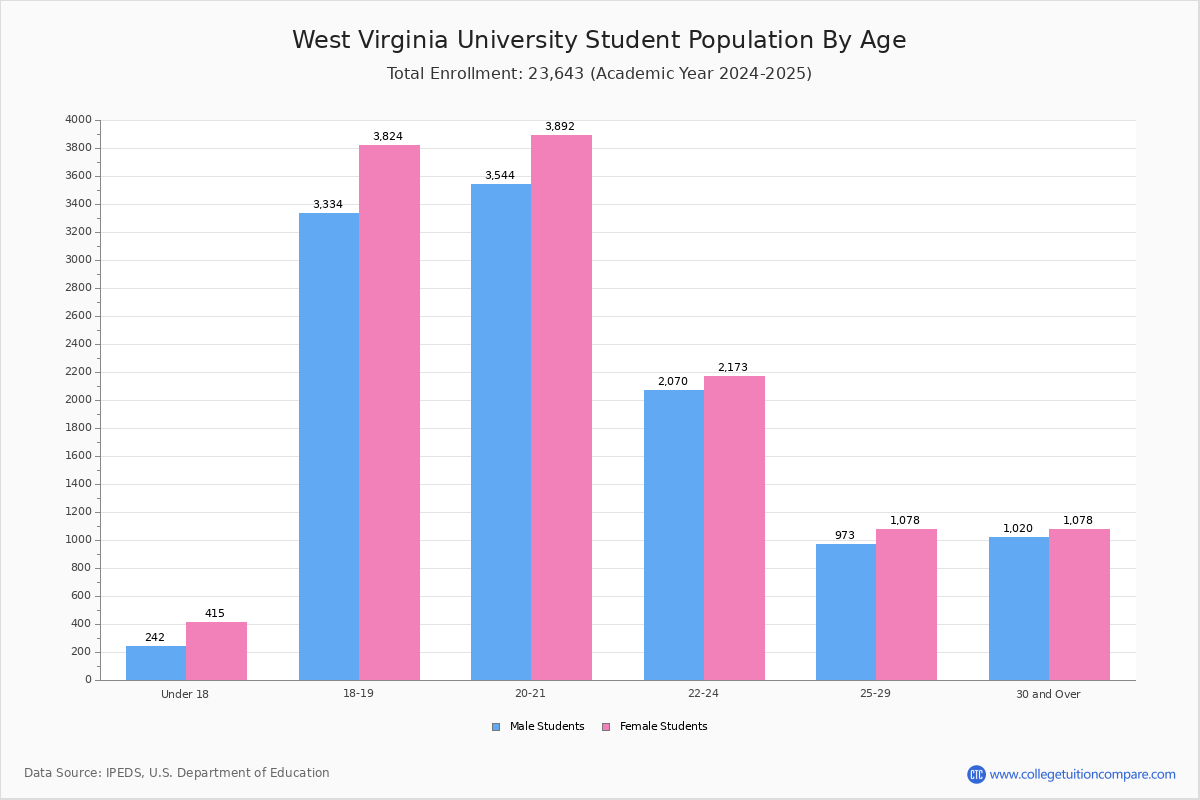
| Age | Total | Men | Women |
|---|---|---|---|
| Under 18 | 668 | 425 | 243 |
| 18-19 | 7,351 | 3,936 | 3,415 |
| 20-21 | 7,751 | 4,186 | 3,565 |
| 22-24 | 4,761 | 2,340 | 2,421 |
| 25-29 | 2,195 | 1,120 | 1,075 |
| 30-34 | 879 | 427 | 452 |
| 35-39 | 445 | 218 | 227 |
| 40-49 | 490 | 287 | 203 |
| 50-64 | 186 | 106 | 80 |
| Over 65 | 15 | 9 | 6 |
| Age | Total | Men | Women |
|---|---|---|---|
| Under 18 | 668 | 425 | 243 |
| 18-19 | 7,351 | 3,936 | 3,415 |
| 20-21 | 7,638 | 4,105 | 3,533 |
| 22-24 | 2,652 | 1,072 | 1,580 |
| 25-29 | 391 | 150 | 241 |
| 30-34 | 133 | 69 | 64 |
| 35-39 | 83 | 38 | 45 |
| 40-49 | 91 | 48 | 43 |
| 50-64 | 49 | 34 | 15 |
| Over 65 | 3 | 3 | 0 |
| Age | Total | Men | Women |
|---|
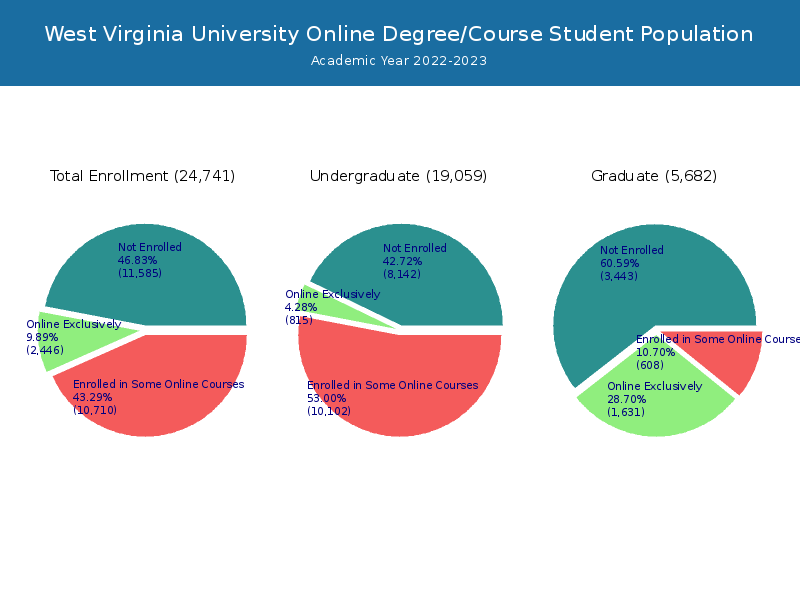
Online Student Enrollment
Distance learning, also called online education, is very attractive to students, especially who want to continue education and work in field. At West Virginia University, 2,446 students are enrolled exclusively in online courses and 10,710 students are enrolled in some online courses.
1,217 students lived in West Virginia or jurisdiction in which the school is located are enrolled exclusively in online courses and 1,229 students live in other State or outside of the United States.
| All Students | Enrolled Exclusively Online Courses | Enrolled in Some Online Courses | |
|---|---|---|---|
| All Students | 24,741 | 2,446 | 10,710 |
| Undergraduate | 19,059 | 815 | 10,102 |
| Graduate | 5,682 | 1,631 | 608 |
| West Virginia Residents | Other States in U.S. | Outside of U.S. | |
|---|---|---|---|
| All Students | 1,217 | 1,196 | 33 |
| Undergraduate | 490 | 321 | 4 |
| Graduate | 727 | 875 | 29 |
Transfer-in Students (Undergraduate)
Among 19,059 enrolled in undergraduate programs, 664 students have transferred-in from other institutions. The percentage of transfer-in students is 3.48%.619 students have transferred in as full-time status and 45 students transferred in as part-time status.
| Number of Students | |
|---|---|
| Regular Full-time | 16,924 |
| Transfer-in Full-time | 619 |
| Regular Part-time | 1,471 |
| Transfer-in Part-time | 45 |