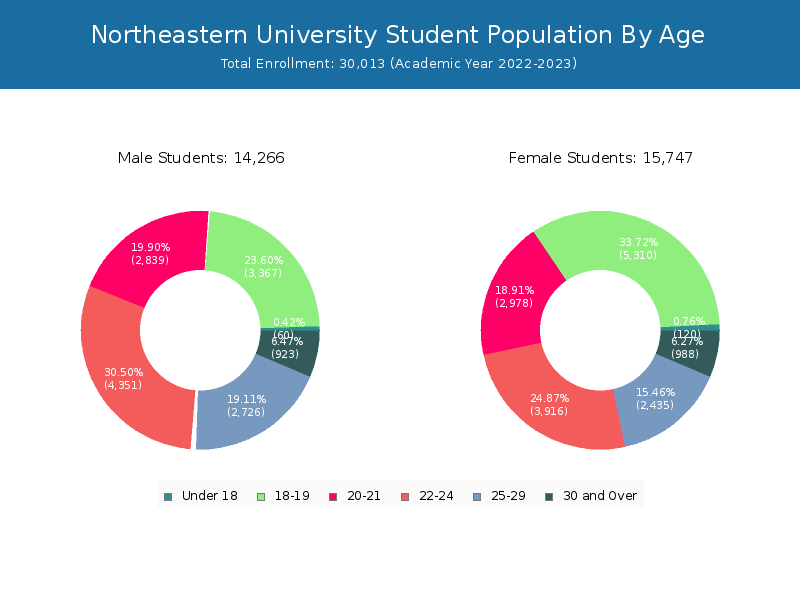
Student Population by Gender
Northeastern University has a total of 30,013 enrolled students for the academic year 2022-2023. 16,302 students have enrolled in undergraduate programs and 13,711 students joined graduate programs.
By gender, 14,266 male and 15,747 female students (the male-female ratio is 48:52) are attending the school. The gender distribution is based on the 2022-2023 data.
| Total | Undergraduate | Graduate | |
|---|---|---|---|
| Total | 30,013 | 16,302 | 13,711 |
| Men | 14,266 | 7,153 | 7,113 |
| Women | 15,747 | 9,149 | 6,598 |
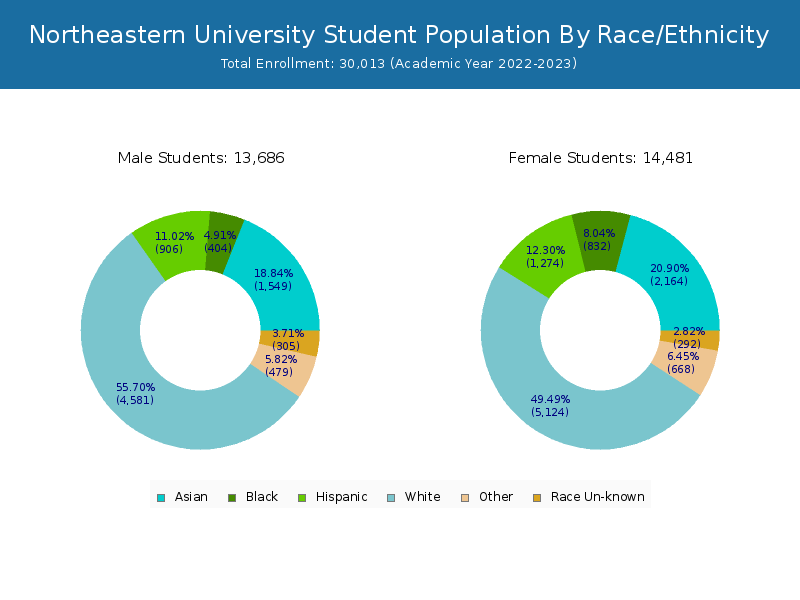
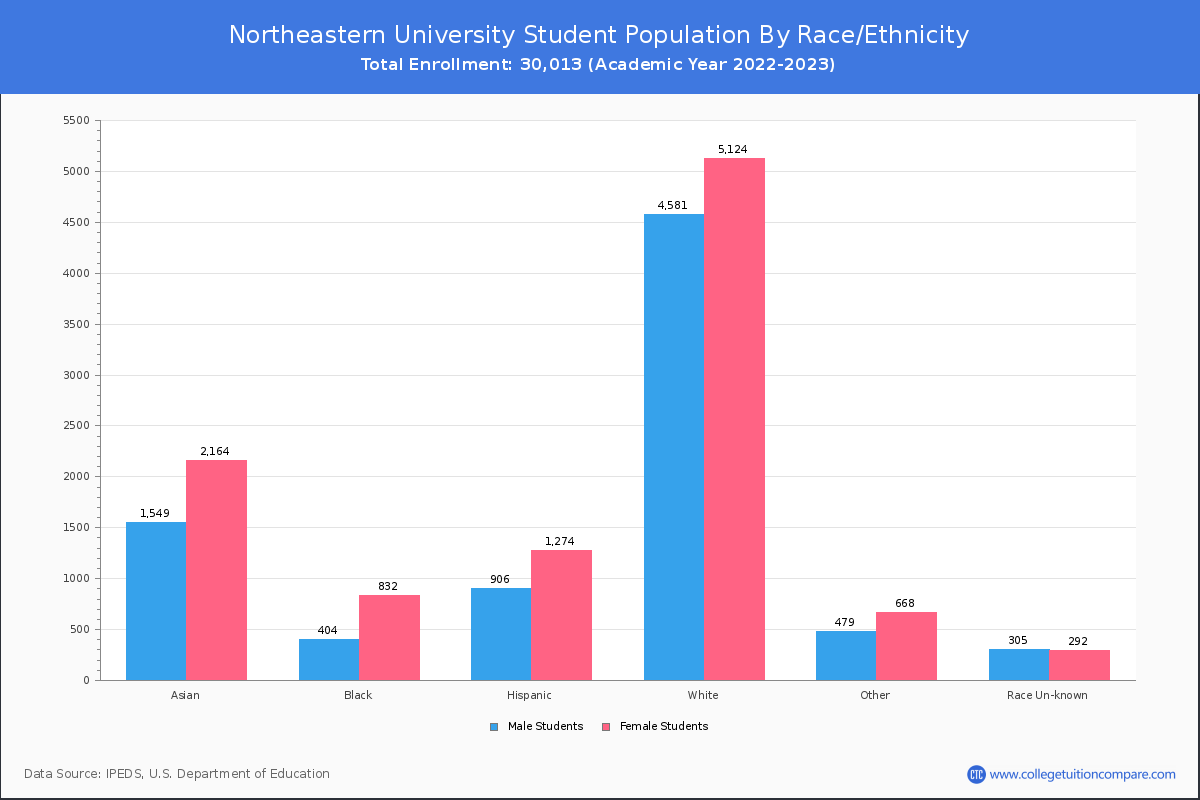
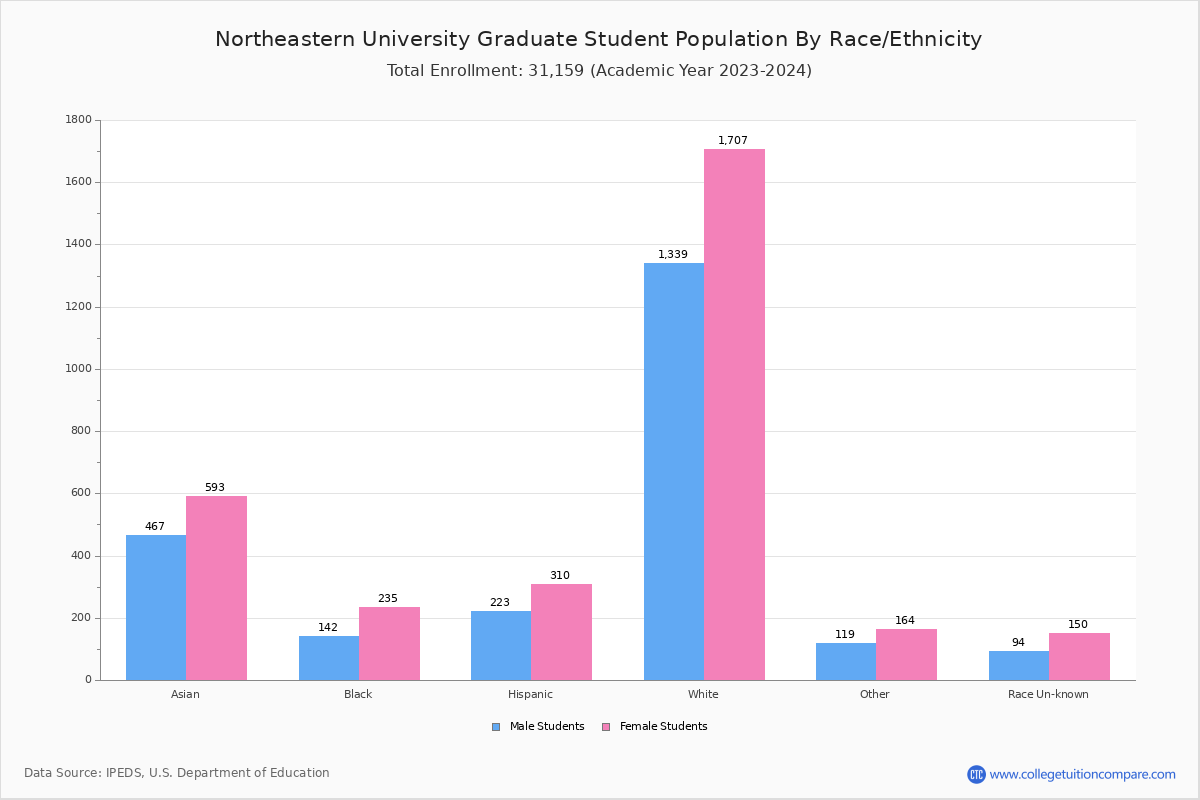
Student Distribution by Race/Ethnicity
By race/ethnicity, 9,865 White, 1,258 Black, and 4,092 Asian students out of a total of 30,013 are attending at Northeastern University. Comprehensive enrollment statistic data by race/ethnicity is shown in the next chart (Academic year 2022-2023 data).
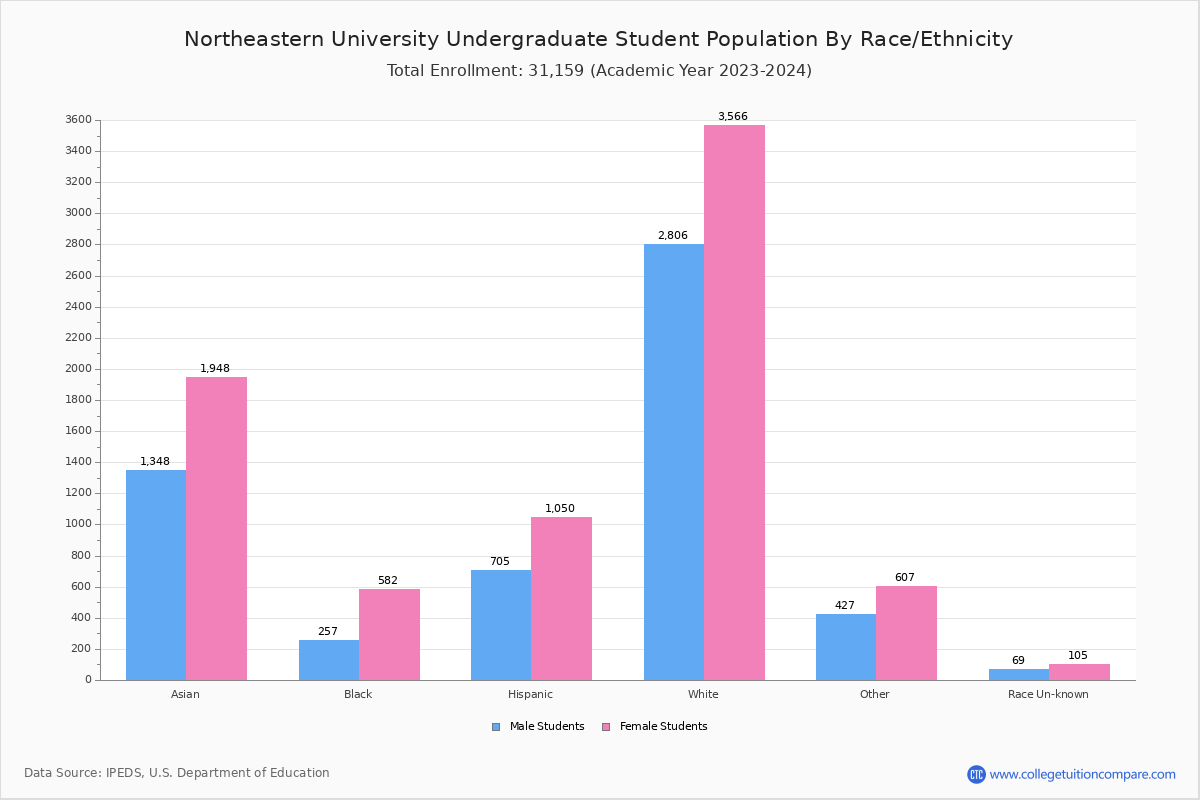
| Race | Total | Men | Women |
|---|---|---|---|
| American Indian or Native American | 12 | 4 | 8 |
| Asian | 4,092 | 1,687 | 2,405 |
| Black | 1,258 | 390 | 868 |
| Hispanic | 2,296 | 913 | 1,383 |
| Native Hawaiian or Other Pacific Islanders | 4 | 2 | 2 |
| White | 9,865 | 4,425 | 5,440 |
| Two or more races | 1,283 | 525 | 758 |
| Race Unknown | 396 | 196 | 200 |
| Race | Total | Men | Women |
|---|---|---|---|
| American Indian or Native American | 9 | 3 | 6 |
| Asian | 3,139 | 1,278 | 1,861 |
| Black | 896 | 268 | 628 |
| Hispanic | 1,843 | 728 | 1,115 |
| Native Hawaiian or Other Pacific Islanders | 3 | 1 | 2 |
| White | 6,843 | 3,097 | 3,746 |
| Two or more races | 1,049 | 427 | 622 |
| Race Unknown | 218 | 104 | 114 |
| Race | Total | Men | Women |
|---|---|---|---|
| American Indian or Native American | 0 | 0 | 0 |
| Asian | 89 | 50 | 39 |
| Black | 24 | 7 | 17 |
| Hispanic | 69 | 28 | 41 |
| Native Hawaiian or Other Pacific Islanders | 0 | 0 | 0 |
| White | 194 | 103 | 91 |
| Two or more races | 21 | 10 | 11 |
| Race Unknown | 10 | 5 | 5 |
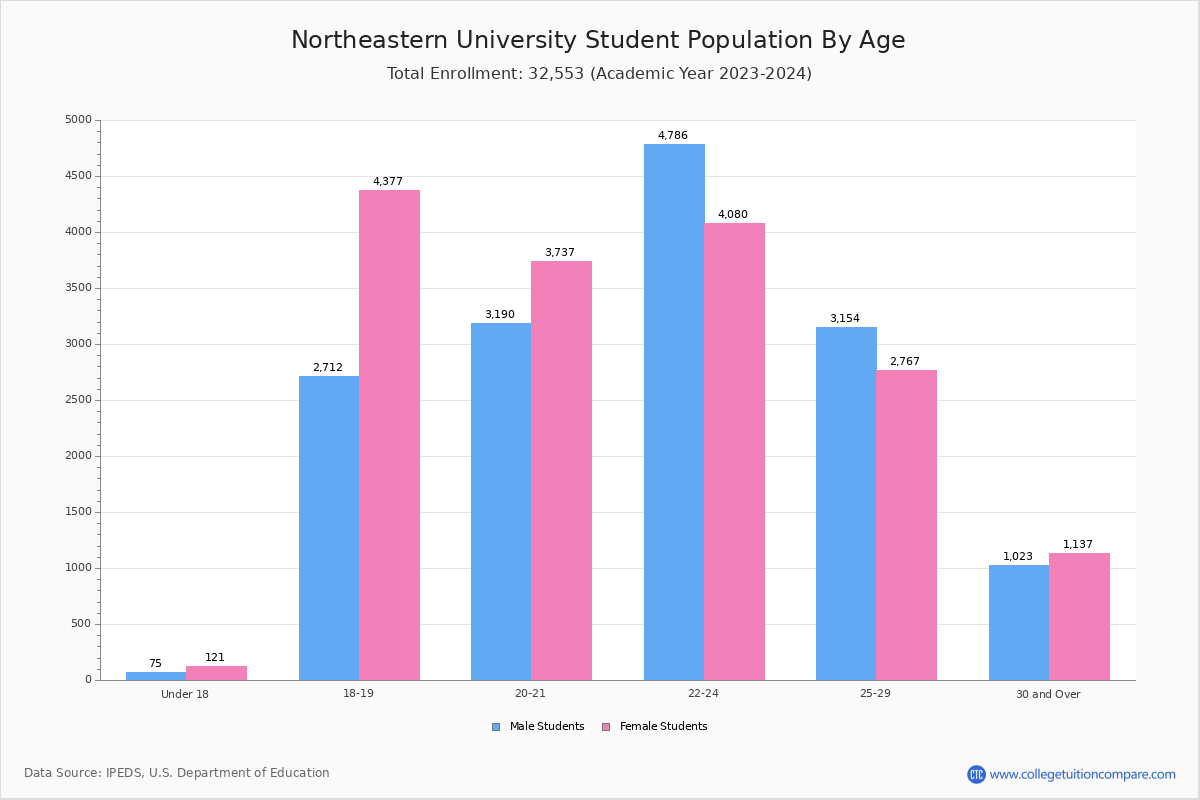
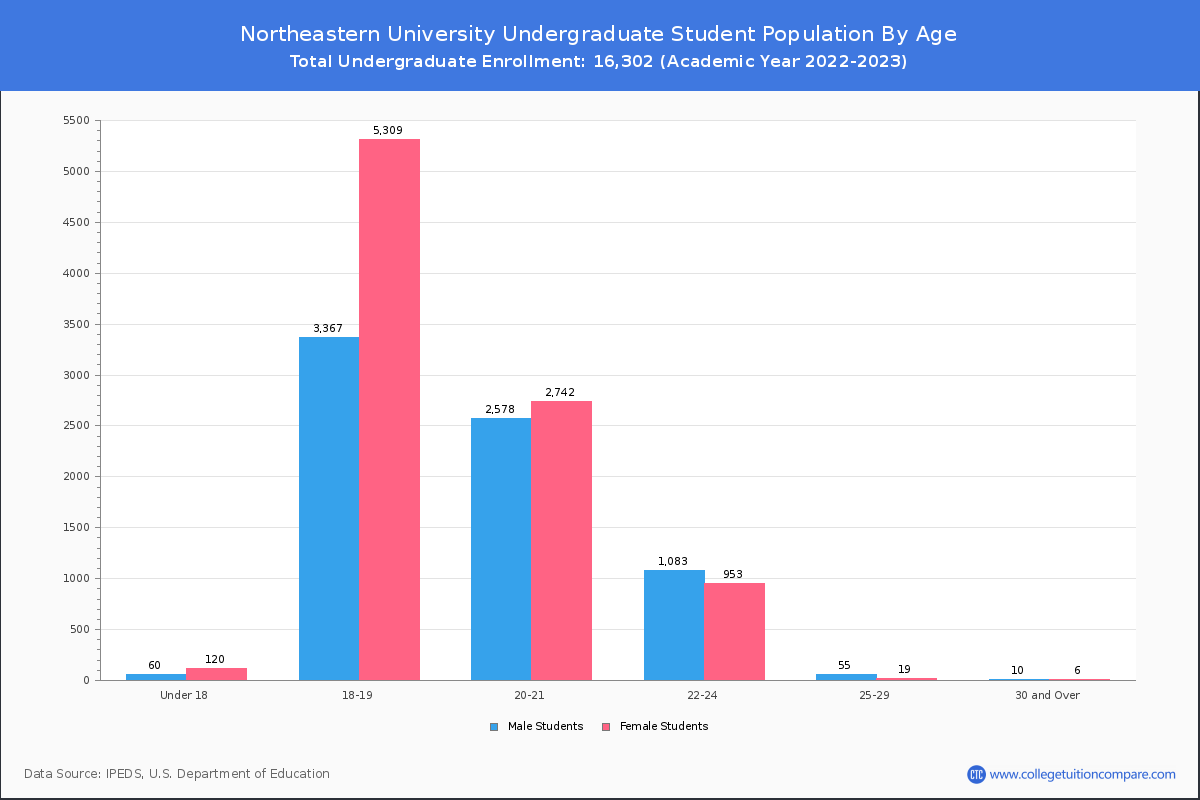
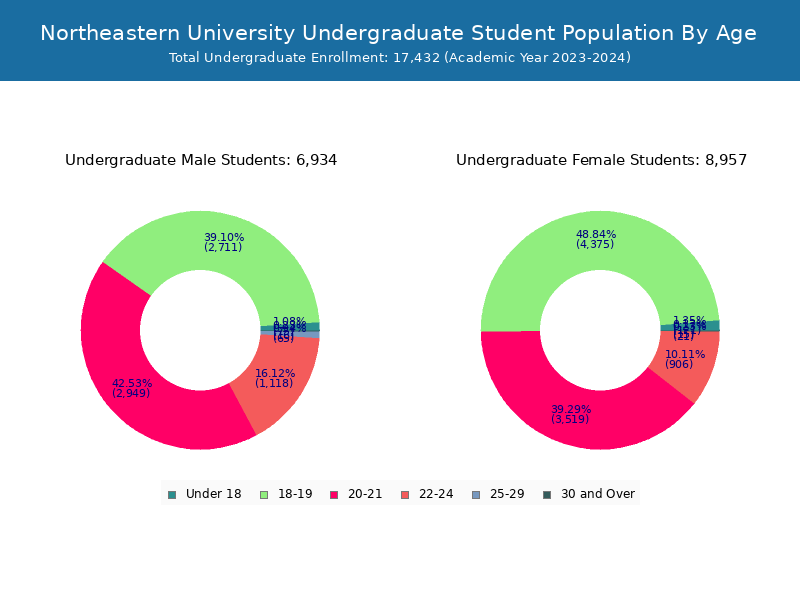
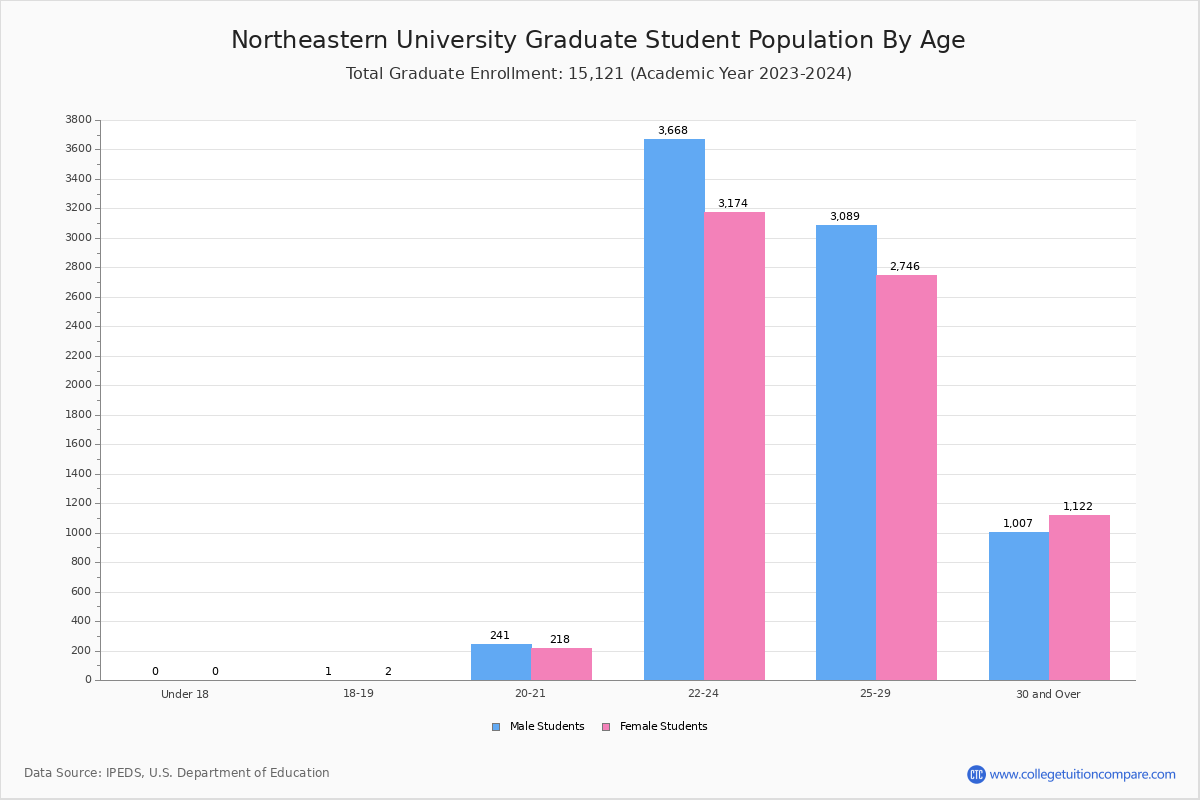
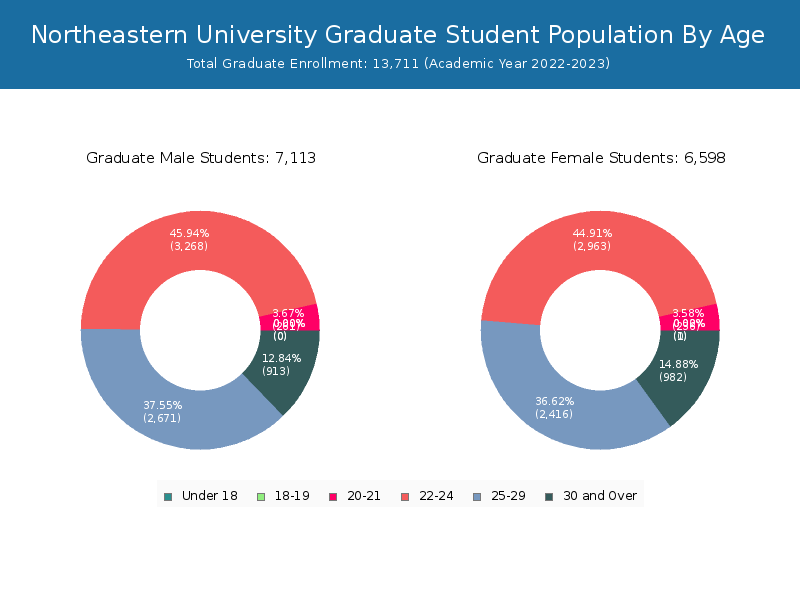
Student Age Distribution
By age, Northeastern has 180 students under 18 years old and 5 students over 65 years old. There are 22,941 students under 25 years old, and 7,072 students over 25 years old out of 30,013 total students.
Northeastern has 16,212 undergraduate students aged under 25 and 90 students aged 25 and over.
It has 6,729 graduate students aged under 25 and 6,982 students aged 25 and over.
| Age | Total | Men | Women |
|---|---|---|---|
| Under 18 | 180 | 120 | 60 |
| 18-19 | 8,677 | 5,310 | 3,367 |
| 20-21 | 5,817 | 2,978 | 2,839 |
| 22-24 | 8,267 | 3,916 | 4,351 |
| 25-29 | 5,161 | 2,435 | 2,726 |
| 30-34 | 1,252 | 650 | 602 |
| 35-39 | 374 | 193 | 181 |
| 40-49 | 224 | 111 | 113 |
| 50-64 | 56 | 31 | 25 |
| Over 65 | 5 | 3 | 2 |
| Age | Total | Men | Women |
|---|---|---|---|
| Under 18 | 180 | 120 | 60 |
| 18-19 | 8,676 | 5,309 | 3,367 |
| 20-21 | 5,320 | 2,742 | 2,578 |
| 22-24 | 2,036 | 953 | 1,083 |
| 25-29 | 74 | 19 | 55 |
| 30-34 | 14 | 6 | 8 |
| 35-39 | 2 | 0 | 2 |
| Age | Total | Men | Women |
|---|
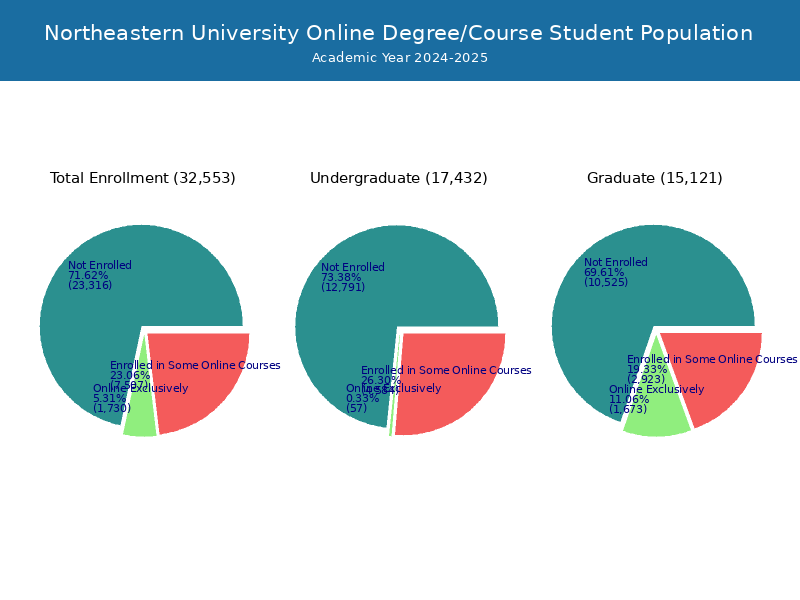
Online Student Enrollment
Distance learning, also called online education, is very attractive to students, especially who want to continue education and work in field. At Northeastern University, 1,058 students are enrolled exclusively in online courses and 6,469 students are enrolled in some online courses.
437 students lived in Massachusetts or jurisdiction in which the school is located are enrolled exclusively in online courses and 621 students live in other State or outside of the United States.
| All Students | Enrolled Exclusively Online Courses | Enrolled in Some Online Courses | |
|---|---|---|---|
| All Students | 30,013 | 1,058 | 6,469 |
| Undergraduate | 16,302 | 46 | 3,973 |
| Graduate | 13,711 | 1,012 | 2,496 |
| Massachusetts Residents | Other States in U.S. | Outside of U.S. | |
|---|---|---|---|
| All Students | 437 | 552 | 69 |
| Undergraduate | 12 | 26 | 8 |
| Graduate | 425 | 526 | 61 |
Transfer-in Students (Undergraduate)
Among 16,302 enrolled in undergraduate programs, 700 students have transferred-in from other institutions. The percentage of transfer-in students is 4.29%.
| Number of Students | |
|---|---|
| Regular Full-time | 15,578 |
| Transfer-in Full-time | 700 |