Student Population by Gender
Bates College has a total of 1,790 enrolled students for the academic year 2022-2023. All 1,790 students are enrolled into undergraduate programs.
By gender, 846 male and 944 female students (the male-female ratio is 47:53) are attending the school. The gender distribution is based on the 2022-2023 data.
| Undergraduate | |
|---|---|
| Total | 1,790 |
| Men | 846 |
| Women | 944 |
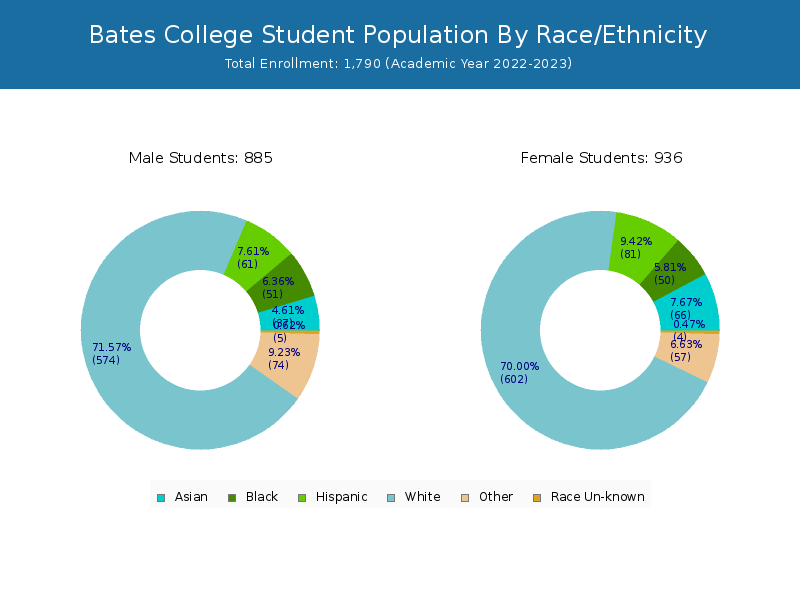
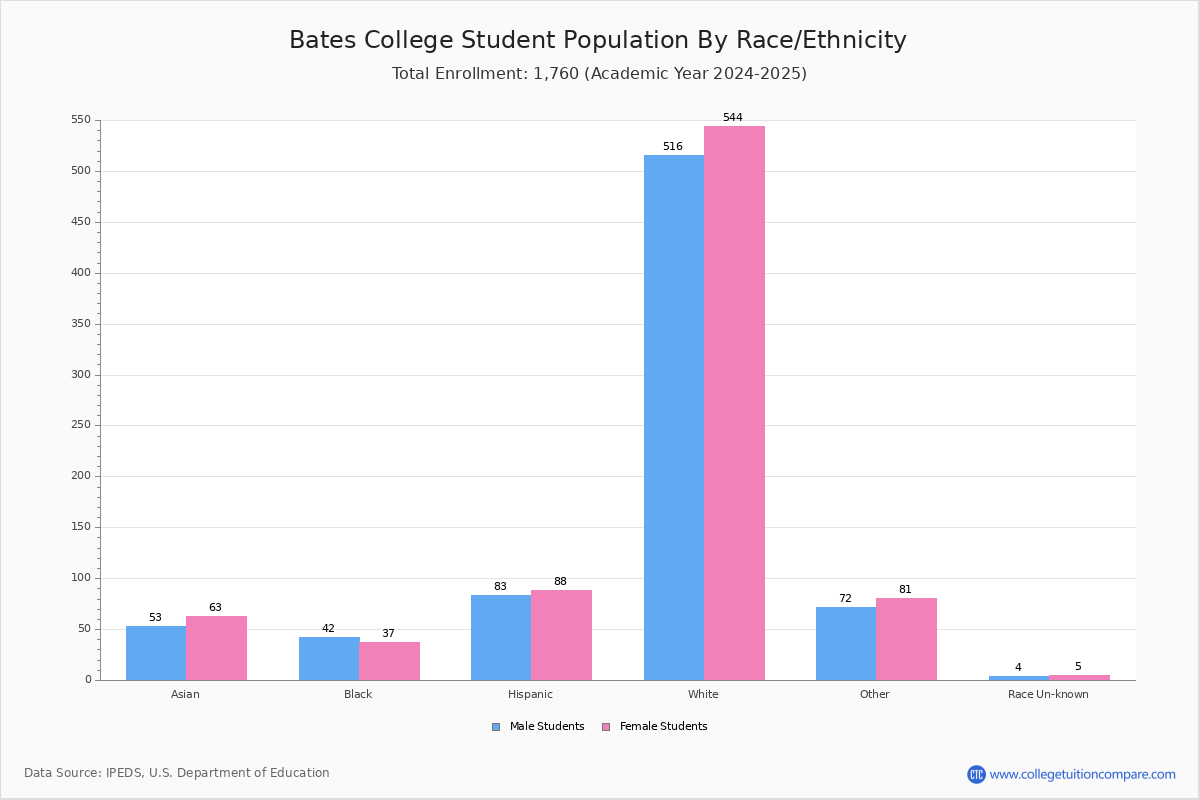
Student Distribution by Race/Ethnicity
By race/ethnicity, 1,116 White, 91 Black, and 114 Asian students out of a total of 1,790 are attending at Bates College. Comprehensive enrollment statistic data by race/ethnicity is shown in the next chart (Academic year 2022-2023 data).
| Race | Total | Men | Women |
|---|---|---|---|
| American Indian or Native American | 4 | 1 | 3 |
| Asian | 114 | 48 | 66 |
| Black | 91 | 44 | 47 |
| Hispanic | 162 | 68 | 94 |
| Native Hawaiian or Other Pacific Islanders | 2 | 2 | 0 |
| White | 1,116 | 525 | 591 |
| Two or more races | 135 | 65 | 70 |
| Race Unknown | 8 | 5 | 3 |
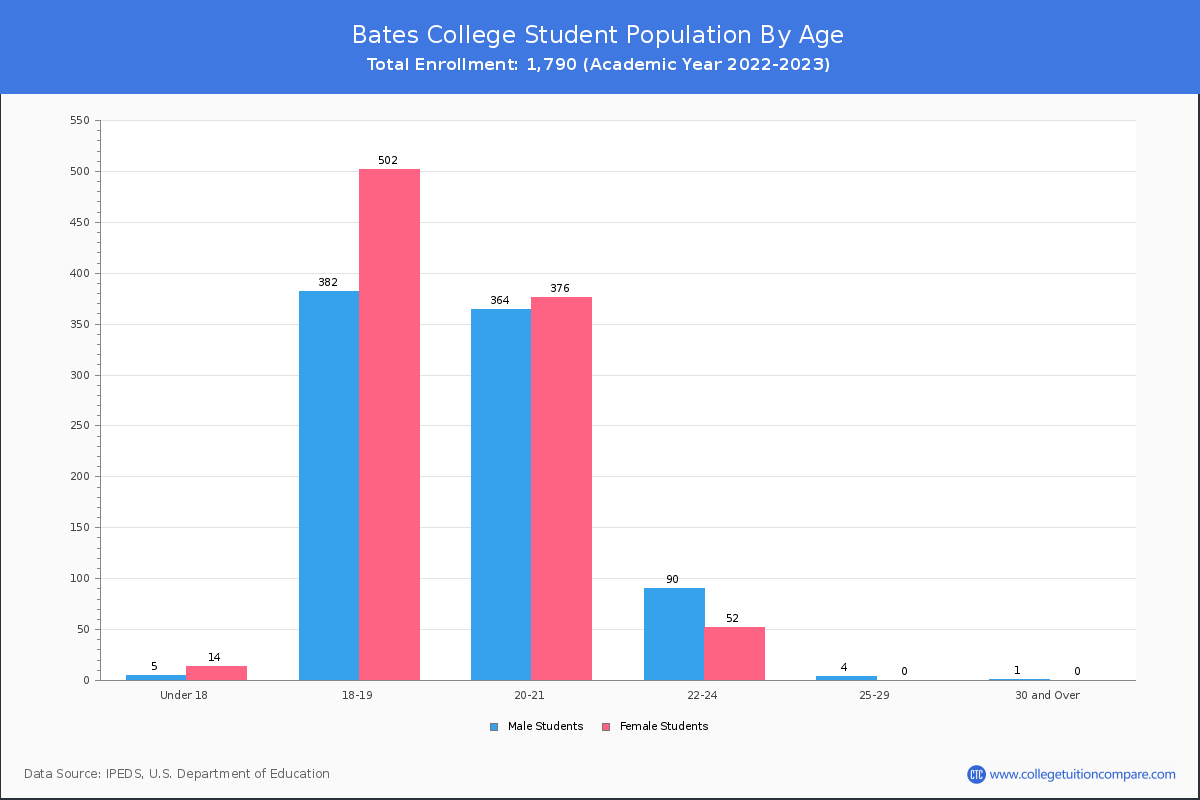
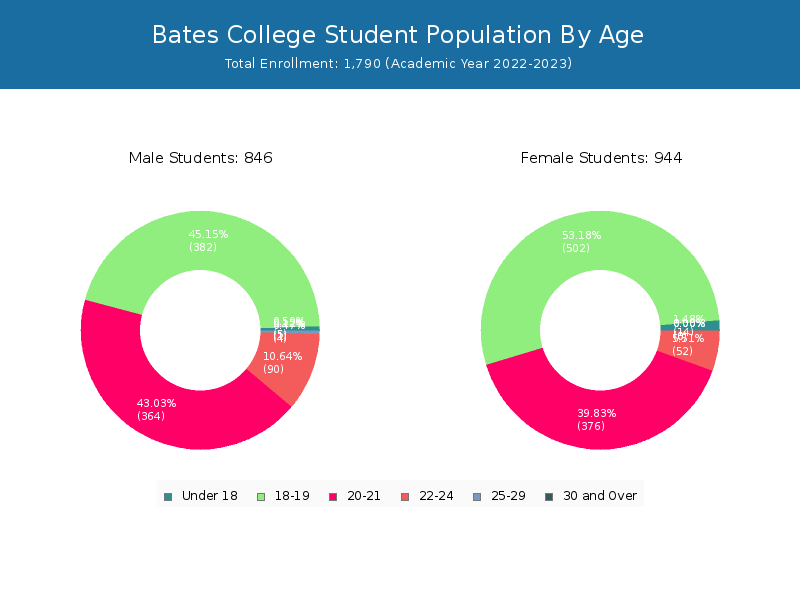
Student Age Distribution
There are 1,785 students under 25 years old, and 5 students over 25 years old out of 1,790 total students.
| Age | Total | Men | Women |
|---|---|---|---|
| Under 18 | 19 | 14 | 5 |
| 18-19 | 884 | 502 | 382 |
| 20-21 | 740 | 376 | 364 |
| 22-24 | 142 | 52 | 90 |
| 25-29 | 4 | 0 | 4 |
Transfer-in Students (Undergraduate)
Among 1,790 enrolled in undergraduate programs, 4 students have transferred-in from other institutions. The percentage of transfer-in students is 0.22%.
| Number of Students | |
|---|---|
| Regular Full-time | 1,786 |
| Transfer-in Full-time | 4 |