Student Population by Gender
Benedictine College has a total of 2,362 enrolled students for the academic year 2022-2023. 2,289 students have enrolled in undergraduate programs and 73 students joined graduate programs.
By gender, 1,163 male and 1,199 female students (the male-female ratio is 49:51) are attending the school. The gender distribution is based on the 2022-2023 data.
| Total | Undergraduate | Graduate | |
|---|---|---|---|
| Total | 2,362 | 2,289 | 73 |
| Men | 1,163 | 1,120 | 43 |
| Women | 1,199 | 1,169 | 30 |
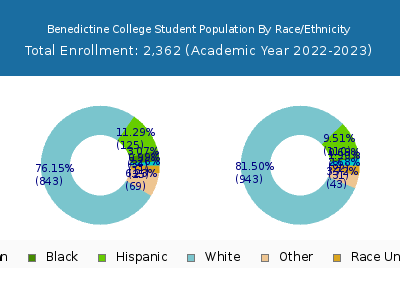
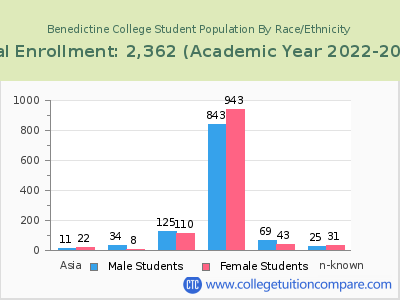
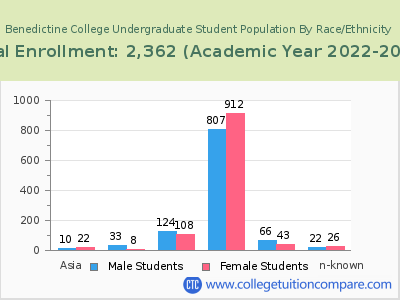
Student Distribution by Race/Ethnicity
| Race | Total | Men | Women |
|---|---|---|---|
| American Indian or Native American | 6 | 5 | 1 |
| Asian | 39 | 17 | 22 |
| Black | 71 | 60 | 11 |
| Hispanic | 260 | 138 | 122 |
| Native Hawaiian or Other Pacific Islanders | 6 | 5 | 1 |
| White | 1,823 | 844 | 979 |
| Two or more races | 71 | 43 | 28 |
| Race Unknown | 64 | 36 | 28 |
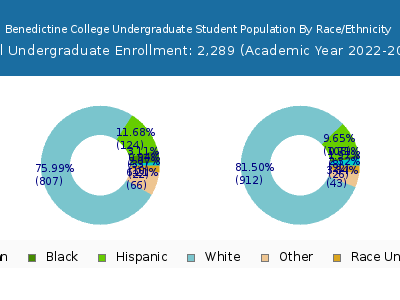
| Race | Total | Men | Women |
|---|---|---|---|
| American Indian or Native American | 6 | 5 | 1 |
| Asian | 36 | 15 | 21 |
| Black | 68 | 58 | 10 |
| Hispanic | 256 | 136 | 120 |
| Native Hawaiian or Other Pacific Islanders | 6 | 5 | 1 |
| White | 1,767 | 813 | 954 |
| Two or more races | 70 | 42 | 28 |
| Race Unknown | 60 | 32 | 28 |
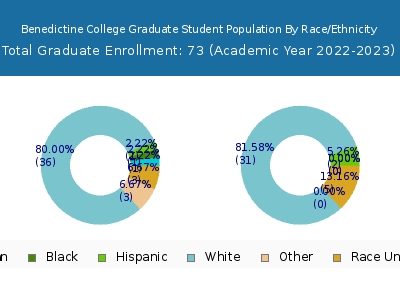
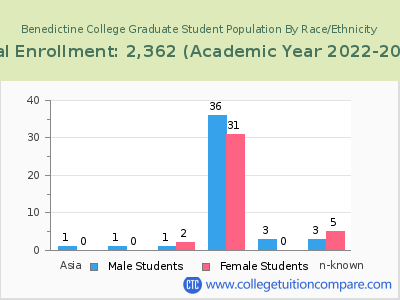
| Race | Total | Men | Women |
|---|---|---|---|
| American Indian or Native American | 0 | 0 | 0 |
| Asian | 0 | 0 | 0 |
| Black | 3 | 3 | 0 |
| Hispanic | 7 | 5 | 2 |
| Native Hawaiian or Other Pacific Islanders | 0 | 0 | 0 |
| White | 42 | 18 | 24 |
| Two or more races | 3 | 2 | 1 |
| Race Unknown | 4 | 2 | 2 |
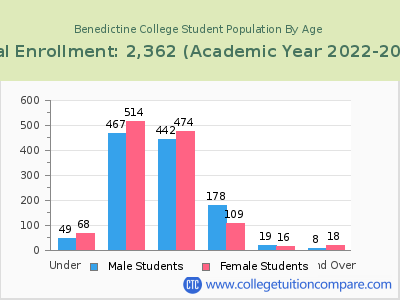
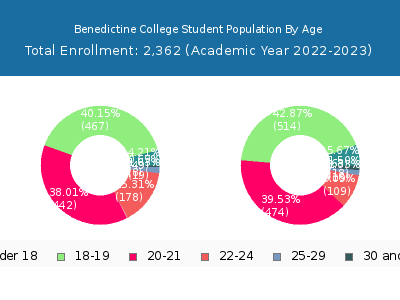
Student Age Distribution
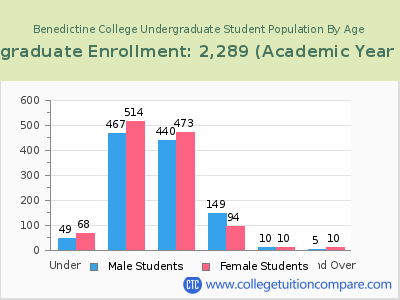
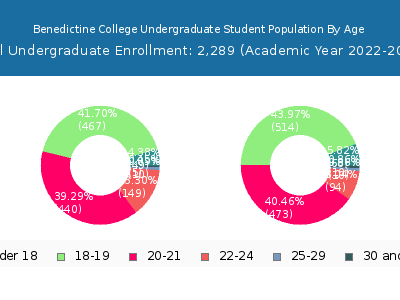
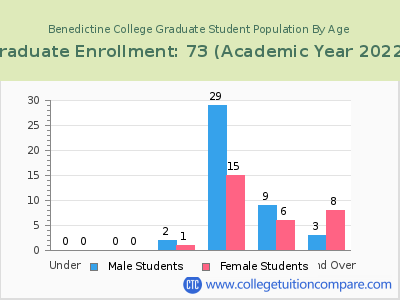
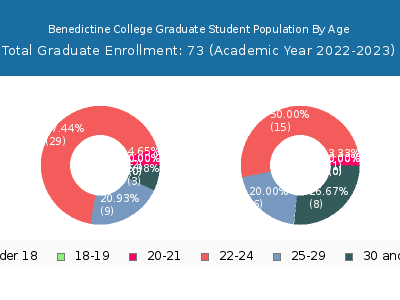
By age, Benedictine has 117 students under 18 years old and 1 students over 65 years old. There are 2,301 students under 25 years old, and 61 students over 25 years old out of 2,362 total students.
In undergraduate programs, 117 students are younger than 18 and 1 students are older than 65. Benedictine has 2,254 undergraduate students aged under 25 and 35 students aged 25 and over.
It has 47 graduate students aged under 25 and 26 students aged 25 and over.
| Age | Total | Men | Women |
|---|---|---|---|
| Under 18 | 117 | 68 | 49 |
| 18-19 | 981 | 514 | 467 |
| 20-21 | 916 | 474 | 442 |
| 22-24 | 287 | 109 | 178 |
| 25-29 | 35 | 16 | 19 |
| 30-34 | 7 | 4 | 3 |
| 35-39 | 7 | 4 | 3 |
| 40-49 | 9 | 8 | 1 |
| 50-64 | 2 | 2 | 0 |
| Over 65 | 1 | 0 | 1 |
| Age | Total | Men | Women |
|---|---|---|---|
| Under 18 | 117 | 68 | 49 |
| 18-19 | 981 | 514 | 467 |
| 20-21 | 913 | 473 | 440 |
| 22-24 | 243 | 94 | 149 |
| 25-29 | 20 | 10 | 10 |
| 30-34 | 3 | 1 | 2 |
| 35-39 | 5 | 3 | 2 |
| 40-49 | 5 | 5 | 0 |
| 50-64 | 1 | 1 | 0 |
| Over 65 | 1 | 0 | 1 |
| Age | Total | Men | Women |
|---|
Online Student Enrollment
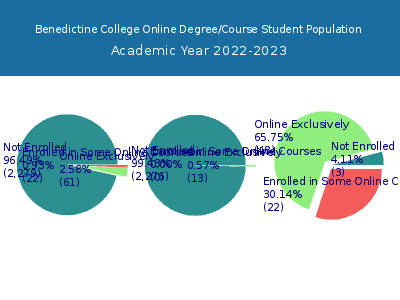
Distance learning, also called online education, is very attractive to students, especially who want to continue education and work in field. At Benedictine College, 61 students are enrolled exclusively in online courses and 22 students are enrolled in some online courses.
27 students lived in Kansas or jurisdiction in which the school is located are enrolled exclusively in online courses and 34 students live in other State or outside of the United States.
| All Students | Enrolled Exclusively Online Courses | Enrolled in Some Online Courses | |
|---|---|---|---|
| All Students | 2,362 | 61 | 22 |
| Undergraduate | 2,289 | 13 | 0 |
| Graduate | 73 | 48 | 22 |
| Kansas Residents | Other States in U.S. | Outside of U.S. | |
|---|---|---|---|
| All Students | 27 | 33 | 1 |
| Undergraduate | 13 | - | 0 |
| Graduate | 14 | 33 | 1 |
Transfer-in Students (Undergraduate)
Among 2,289 enrolled in undergraduate programs, 63 students have transferred-in from other institutions. The percentage of transfer-in students is 2.75%.
| Number of Students | |
|---|---|
| Regular Full-time | 2,072 |
| Transfer-in Full-time | 63 |
