Student Population by Gender
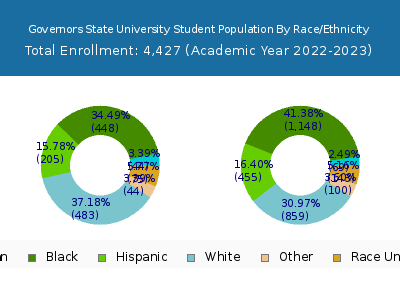
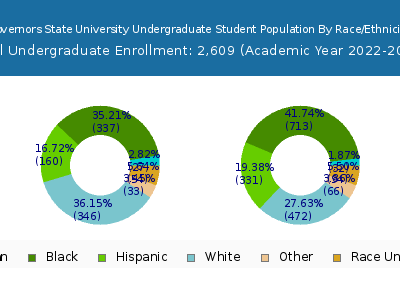
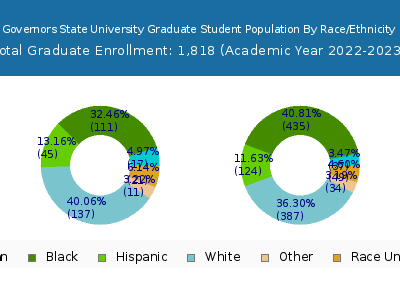
Governors State University has a total of 4,427 enrolled students for the academic year 2022-2023. 2,609 students have enrolled in undergraduate programs and 1,818 students joined graduate programs.
By gender, 1,600 male and 2,827 female students (the male-female ratio is 36:64) are attending the school. The gender distribution is based on the 2022-2023 data.
| Total | Undergraduate | Graduate | |
|---|---|---|---|
| Total | 4,427 | 2,609 | 1,818 |
| Men | 1,600 | 961 | 639 |
| Women | 2,827 | 1,648 | 1,179 |
Student Distribution by Race/Ethnicity
| Race | Total | Men | Women |
|---|---|---|---|
| American Indian or Native American | 6 | 1 | 5 |
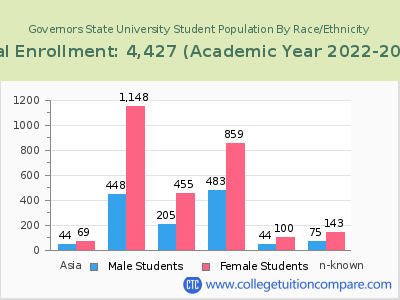
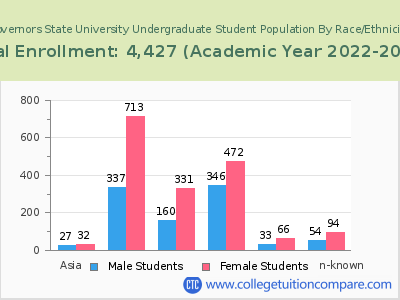
| Asian | 110 | 41 | 69 |
| Black | 1,566 | 432 | 1,134 |
| Hispanic | 662 | 216 | 446 |
| Native Hawaiian or Other Pacific Islanders | 3 | 1 | 2 |
| White | 1,279 | 449 | 830 |
| Two or more races | 124 | 41 | 83 |
| Race Unknown | 124 | 49 | 75 |
| Race | Total | Men | Women |
|---|---|---|---|
| American Indian or Native American | 6 | 1 | 5 |
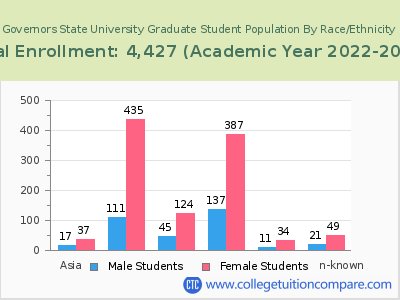
| Asian | 61 | 28 | 33 |
| Black | 1,043 | 336 | 707 |
| Hispanic | 503 | 176 | 327 |
| Native Hawaiian or Other Pacific Islanders | 2 | 1 | 1 |
| White | 774 | 317 | 457 |
| Two or more races | 90 | 32 | 58 |
| Race Unknown | 83 | 36 | 47 |
| Race | Total | Men | Women |
|---|---|---|---|
| American Indian or Native American | 3 | 0 | 3 |
| Asian | 11 | 7 | 4 |
| Black | 149 | 46 | 103 |
| Hispanic | 97 | 40 | 57 |
| Native Hawaiian or Other Pacific Islanders | 0 | 0 | 0 |
| White | 142 | 59 | 83 |
| Two or more races | 17 | 9 | 8 |
| Race Unknown | 1 | 1 | 0 |
Student Age Distribution
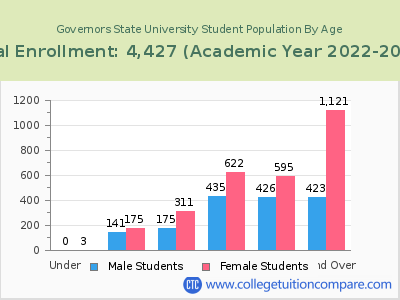
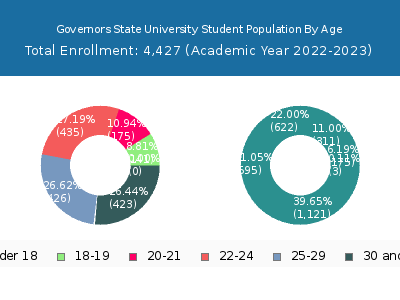
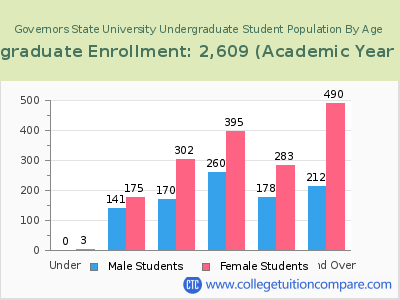
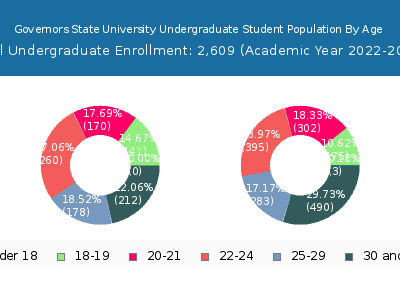
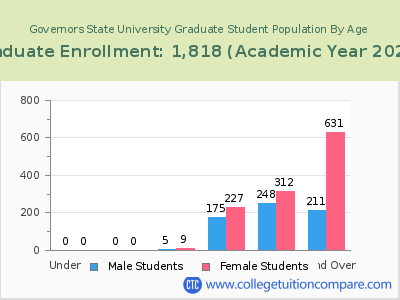
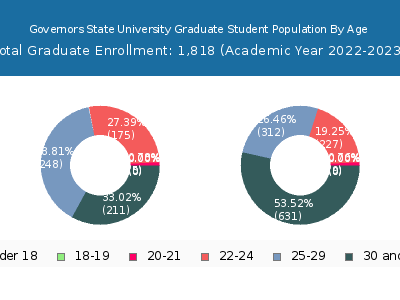
By age, GSU has 3 students under 18 years old and 35 students over 65 years old. There are 1,862 students under 25 years old, and 2,565 students over 25 years old out of 4,427 total students.
In undergraduate programs, 3 students are younger than 18 and 15 students are older than 65. GSU has 1,446 undergraduate students aged under 25 and 1,163 students aged 25 and over.
It has 416 graduate students aged under 25 and 1,402 students aged 25 and over.
| Age | Total | Men | Women |
|---|---|---|---|
| Under 18 | 3 | 3 | 0 |
| 18-19 | 316 | 175 | 141 |
| 20-21 | 486 | 311 | 175 |
| 22-24 | 1,057 | 622 | 435 |
| 25-29 | 1,021 | 595 | 426 |
| 30-34 | 449 | 303 | 146 |
| 35-39 | 282 | 219 | 63 |
| 40-49 | 465 | 347 | 118 |
| 50-64 | 313 | 233 | 80 |
| Over 65 | 35 | 19 | 16 |
| Age | Total | Men | Women |
|---|---|---|---|
| Under 18 | 3 | 3 | 0 |
| 18-19 | 316 | 175 | 141 |
| 20-21 | 472 | 302 | 170 |
| 22-24 | 655 | 395 | 260 |
| 25-29 | 461 | 283 | 178 |
| 30-34 | 230 | 148 | 82 |
| 35-39 | 124 | 101 | 23 |
| 40-49 | 197 | 140 | 57 |
| 50-64 | 136 | 95 | 41 |
| Over 65 | 15 | 6 | 9 |
| Age | Total | Men | Women |
|---|
Online Student Enrollment
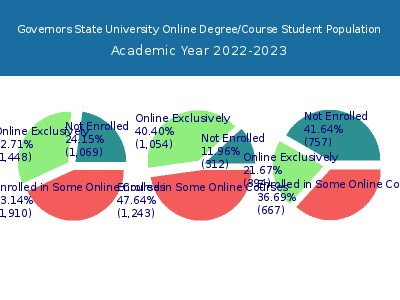
Distance learning, also called online education, is very attractive to students, especially who want to continue education and work in field. At Governors State University, 1,448 students are enrolled exclusively in online courses and 1,910 students are enrolled in some online courses.
1,384 students lived in Illinois or jurisdiction in which the school is located are enrolled exclusively in online courses and 64 students live in other State or outside of the United States.
| All Students | Enrolled Exclusively Online Courses | Enrolled in Some Online Courses | |
|---|---|---|---|
| All Students | 4,427 | 1,448 | 1,910 |
| Undergraduate | 2,609 | 1,054 | 1,243 |
| Graduate | 1,818 | 394 | 667 |
| Illinois Residents | Other States in U.S. | Outside of U.S. | |
|---|---|---|---|
| All Students | 1,384 | 46 | 18 |
| Undergraduate | 1,029 | 24 | 1 |
| Graduate | 355 | 22 | 17 |
Transfer-in Students (Undergraduate)
Among 2,609 enrolled in undergraduate programs, 432 students have transferred-in from other institutions. The percentage of transfer-in students is 16.56%.318 students have transferred in as full-time status and 114 students transferred in as part-time status.
| Number of Students | |
|---|---|
| Regular Full-time | 1,311 |
| Transfer-in Full-time | 318 |
| Regular Part-time | 866 |
| Transfer-in Part-time | 114 |
