Student Population by Gender
San Diego Christian College has a total of 355 enrolled students for the academic year 2022-2023. 328 students have enrolled in undergraduate programs and 27 students joined graduate programs.
By gender, 165 male and 190 female students (the male-female ratio is 46:54) are attending the school. The gender distribution is based on the 2022-2023 data.
| Total | Undergraduate | Graduate | |
|---|---|---|---|
| Total | 355 | 328 | 27 |
| Men | 165 | 154 | 11 |
| Women | 190 | 174 | 16 |
Student Distribution by Race/Ethnicity
| Race | Total | Men | Women |
|---|---|---|---|
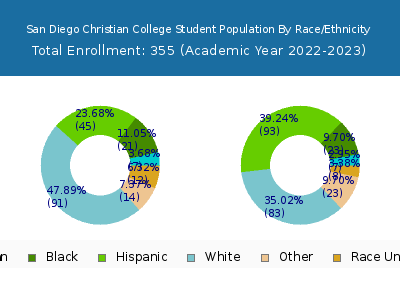
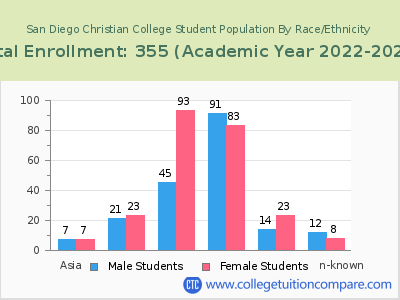
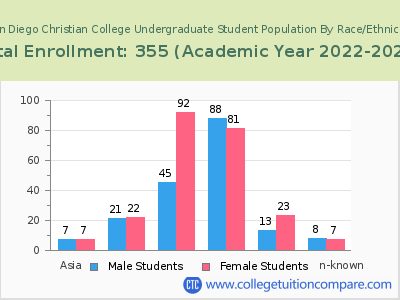
| American Indian or Native American | 6 | 1 | 5 |
| Asian | 9 | 4 | 5 |
| Black | 27 | 19 | 8 |
| Hispanic | 140 | 57 | 83 |
| Native Hawaiian or Other Pacific Islanders | 5 | 3 | 2 |
| White | 108 | 54 | 54 |
| Two or more races | 24 | 9 | 15 |
| Race Unknown | 26 | 11 | 15 |
| Race | Total | Men | Women |
|---|---|---|---|
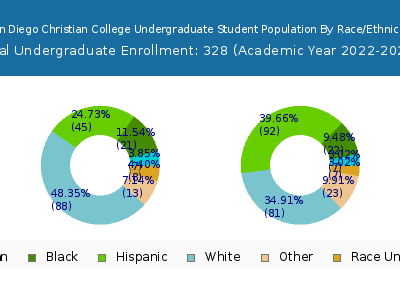
| American Indian or Native American | 5 | 0 | 5 |
| Asian | 8 | 4 | 4 |
| Black | 26 | 19 | 7 |
| Hispanic | 132 | 56 | 76 |
| Native Hawaiian or Other Pacific Islanders | 5 | 3 | 2 |
| White | 96 | 47 | 49 |
| Two or more races | 22 | 8 | 14 |
| Race Unknown | 24 | 10 | 14 |
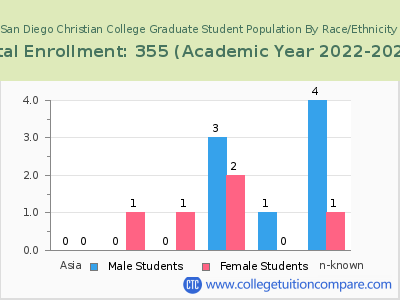
| Race | Total | Men | Women |
|---|---|---|---|
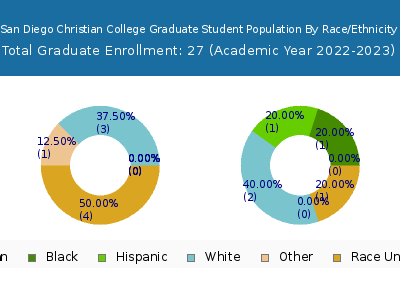
| American Indian or Native American | 1 | 0 | 1 |
| Asian | 3 | 1 | 2 |
| Black | 7 | 6 | 1 |
| Hispanic | 27 | 13 | 14 |
| Native Hawaiian or Other Pacific Islanders | 2 | 2 | 0 |
| White | 21 | 8 | 13 |
| Two or more races | 5 | 3 | 2 |
| Race Unknown | 10 | 4 | 6 |
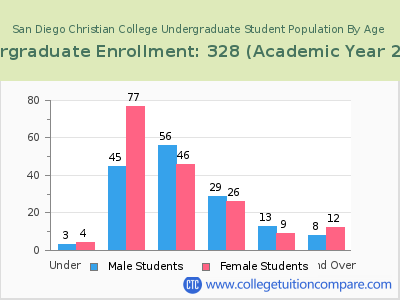
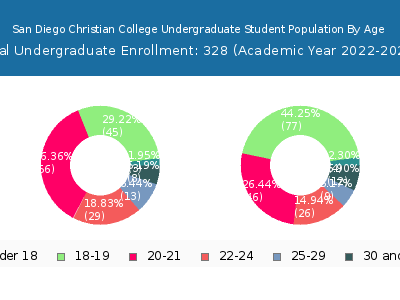
Student Age Distribution
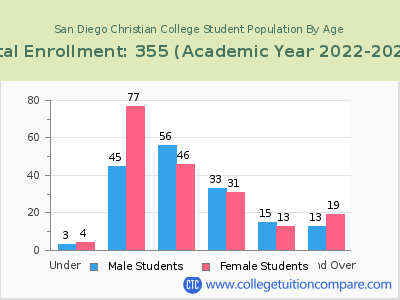
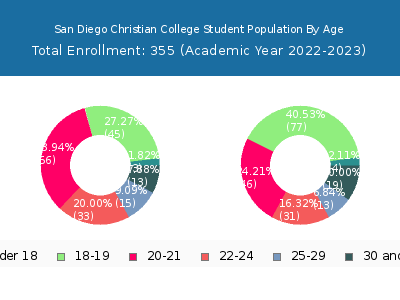
| Age | Total | Men | Women |
|---|---|---|---|
| Under 18 | 7 | 4 | 3 |
| 18-19 | 122 | 77 | 45 |
| 20-21 | 102 | 46 | 56 |
| 22-24 | 64 | 31 | 33 |
| 25-29 | 28 | 13 | 15 |
| 30-34 | 11 | 7 | 4 |
| 35-39 | 6 | 4 | 2 |
| 40-49 | 11 | 5 | 6 |
| 50-64 | 4 | 3 | 1 |
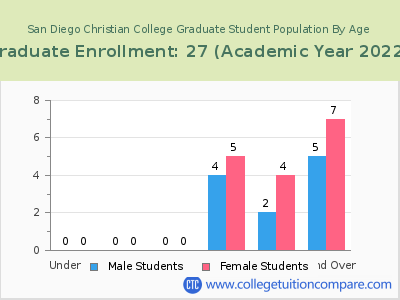
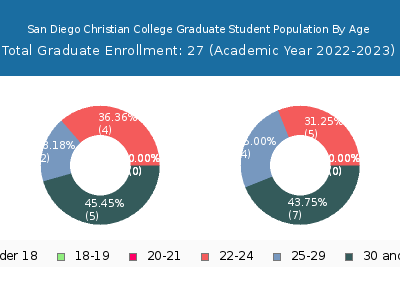
| Age | Total | Men | Women |
|---|---|---|---|
| Under 18 | 7 | 4 | 3 |
| 18-19 | 122 | 77 | 45 |
| 20-21 | 102 | 46 | 56 |
| 22-24 | 55 | 26 | 29 |
| 25-29 | 22 | 9 | 13 |
| 30-34 | 11 | 7 | 4 |
| 35-39 | 3 | 1 | 2 |
| 40-49 | 4 | 2 | 2 |
| 50-64 | 2 | 2 | 0 |
| Age | Total | Men | Women |
|---|
Online Student Enrollment
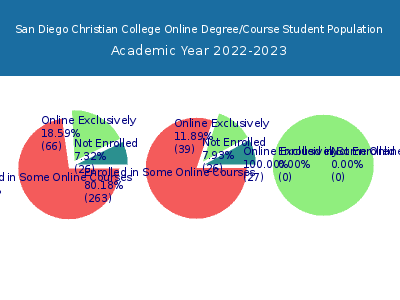
Distance learning, also called online education, is very attractive to students, especially who want to continue education and work in field. At San Diego Christian College, 66 students are enrolled exclusively in online courses and 263 students are enrolled in some online courses.
57 students lived in California or jurisdiction in which the school is located are enrolled exclusively in online courses and 9 students live in other State or outside of the United States.
| All Students | Enrolled Exclusively Online Courses | Enrolled in Some Online Courses | |
|---|---|---|---|
| All Students | 355 | 66 | 263 |
| Undergraduate | 328 | 39 | 263 |
| Graduate | 27 | 27 | 0 |
| California Residents | Other States in U.S. | Outside of U.S. | |
|---|---|---|---|
| All Students | 57 | 9 | 0 |
| Undergraduate | 33 | 6 | 0 |
| Graduate | 24 | 3 | 0 |
Transfer-in Students (Undergraduate)
Among 328 enrolled in undergraduate programs, 76 students have transferred-in from other institutions. The percentage of transfer-in students is 23.17%.57 students have transferred in as full-time status and 19 students transferred in as part-time status.
| Number of Students | |
|---|---|
| Regular Full-time | 197 |
| Transfer-in Full-time | 57 |
| Regular Part-time | 55 |
| Transfer-in Part-time | 19 |
