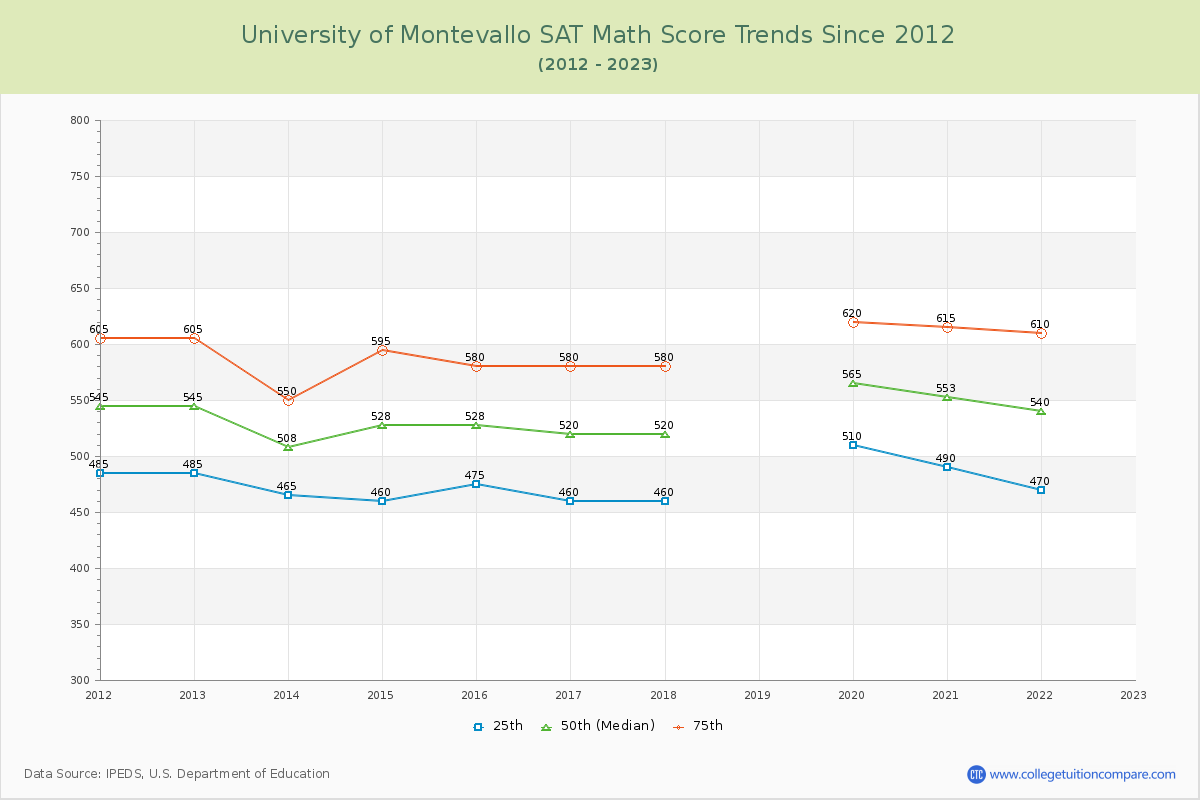
SAT Scores Over Time
The 2023 SAT score is at U of Montevallo. Over the past 12 years, the average SAT score is 902 (25th percentile) and 1133 (75th percentile). Compared to similar schools, the submitted SAT scores are around national average at U of Montevallo.
The following table and chart illustrate the changes in SAT scores at University of Montevallo since 2012.
| Year | Total | Math | Evidence-Based Reading and Writing | ||||||
|---|---|---|---|---|---|---|---|---|---|
| 25th | 50th | 75th | 25th | 50th | 75th | 25th | 50th | 75th | |
| 2012-13 | 485 | 545 | 605 | 485 | 545 | 605 | - | - | - |
| 2013-14 | 960 | 1,062 | 1,163 | 465 | 508 | 550 | 495 | 554 | 613 |
| 2014-15 | 955 | 1,075 | 1,195 | 460 | 528 | 595 | 495 | 548 | 600 |
| 2015-16 | 930 | 1,053 | 1,175 | 475 | 528 | 580 | 455 | 525 | 595 |
| 2016-17 | 900 | 1,050 | 1,200 | 460 | 520 | 580 | 440 | 530 | 620 |
| 2017-18 | 900 | 1,050 | 1,200 | 460 | 520 | 580 | 440 | 530 | 620 |
| 2018-19 | - | - | - | - | - | - | - | - | - |
| 2019-20 | 1,030 | 1,135 | 1,240 | 510 | 565 | 620 | 520 | 570 | 620 |
| 2020-21 | 990 | 1,103 | 1,215 | 490 | 553 | 615 | 500 | 550 | 600 |
| 2021-22 | 970 | 1,085 | 1,200 | 470 | 540 | 610 | 500 | 545 | 590 |
| 2022-23 | - | - | - | - | - | - | - | - | - |
| Average | 902 | 1017 | 1133 | 475 | 534 | 593 | 481 | 544 | 607 |
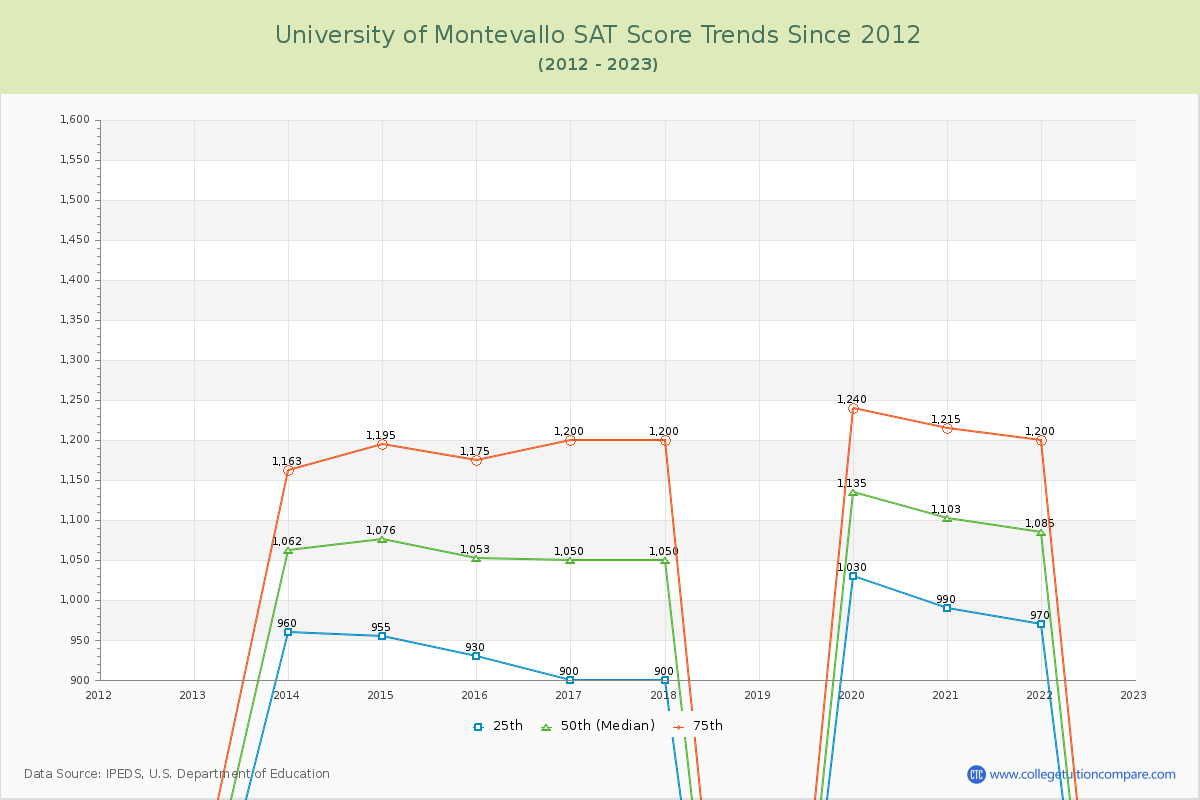
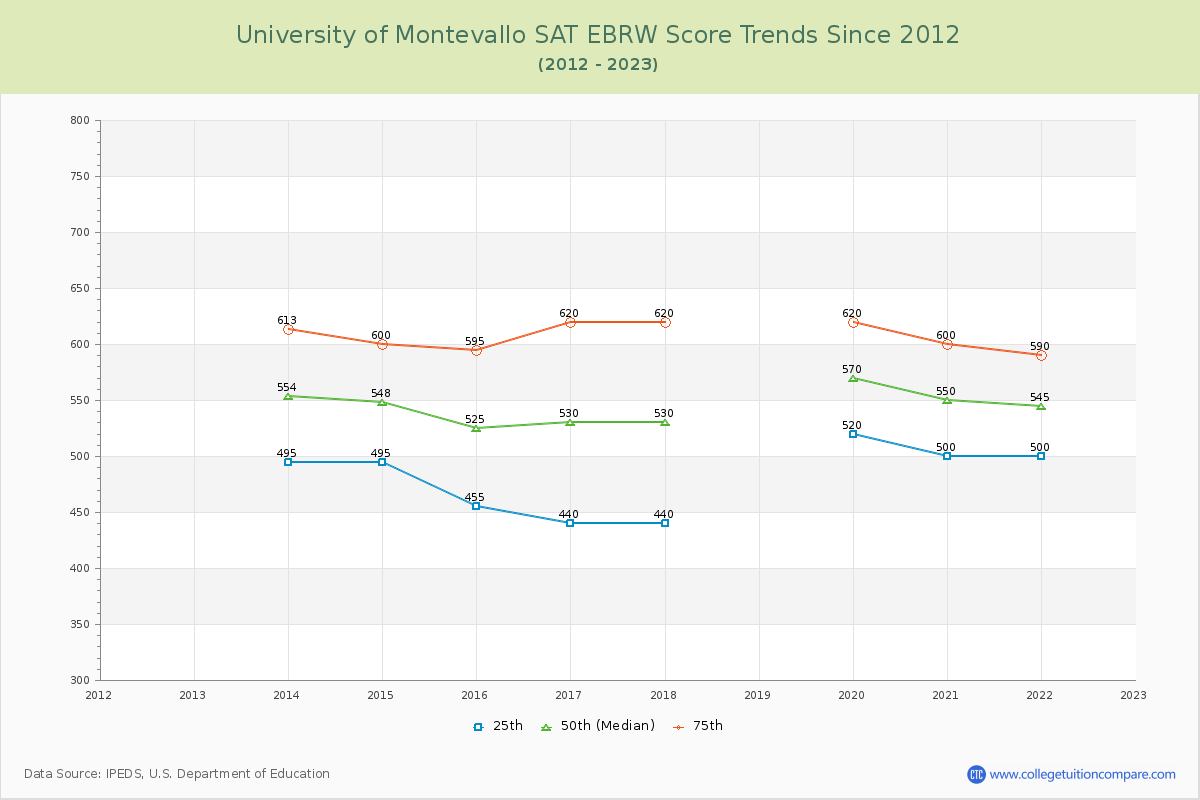
*SAT Evidence-Based Reading and Writing replaces SAT critical reading and writing since year 2017.
**The SAT Writing score is excluded from the total scores for year from 2011 to 2016.