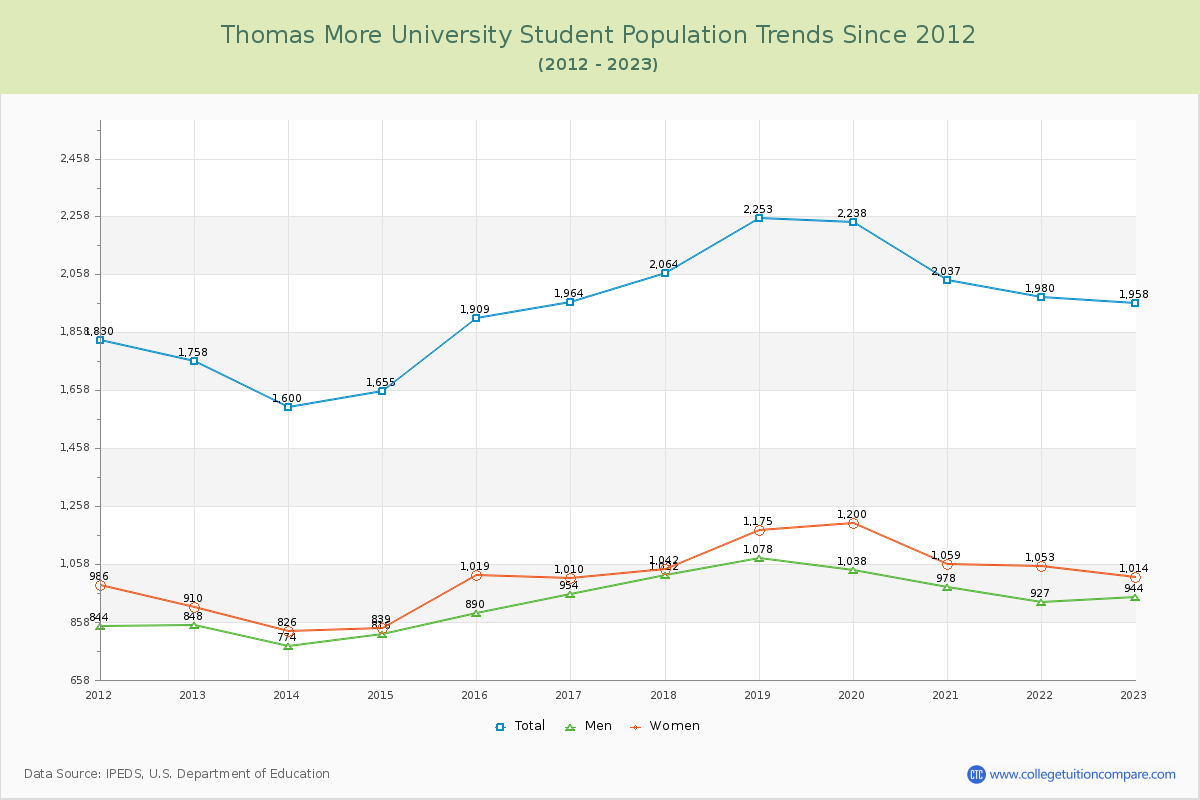
Student Population Changes
The average student population over the last 12 years is 1,947 where 1,958 students are attending the school for the academic year 2022-2023.
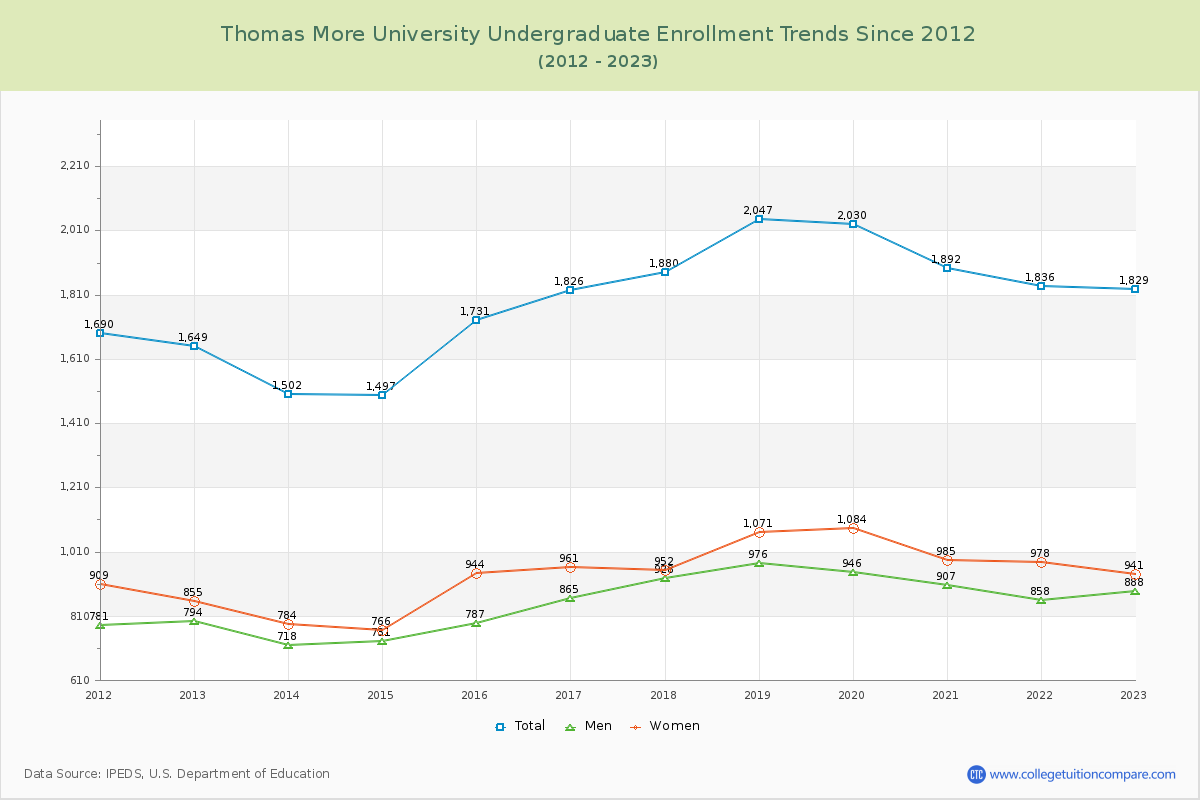
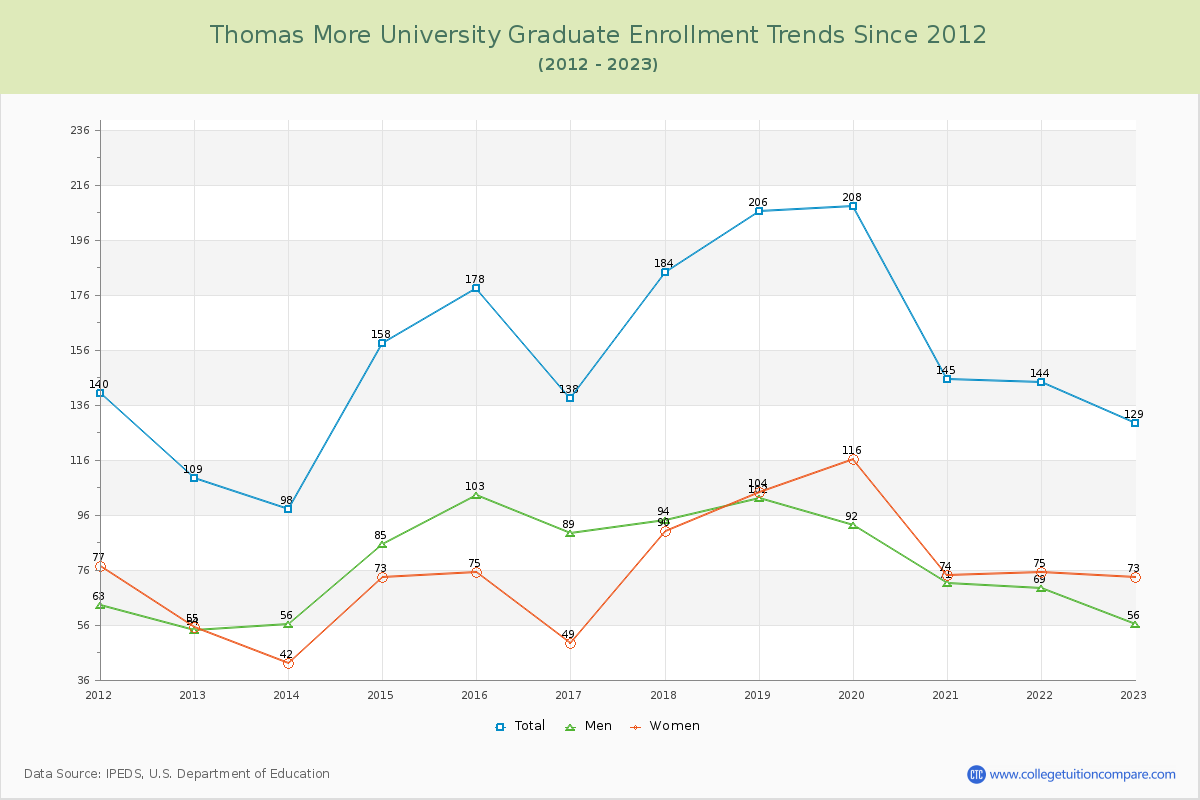
93.41% of total students is undergraduate students and 6.59% students is graduate students. The number of undergraduate students has increased by 180 and the graduate enrollment has increased by 20 over past 10 years.
The female to male ratio is 1.07 to 1 and it means that there are similar numbers of female and male students enrolled in TMC.
The following table and chart illustrate the changes in student population by gender at Thomas More University since 2012.
| Year | Total | Undergraduate | Graduate | ||||
|---|---|---|---|---|---|---|---|
| Total | Men | Women | Total | Men | Women | ||
| 2012-13 | 1,758 | 1,649 | 794 | 855 | 109 | 54 | 55 |
| 2013-14 | 1,600 -158 | 1,502 -147 | 718 -76 | 784 -71 | 98 -11 | 56 2 | 42 -13 |
| 2014-15 | 1,655 55 | 1,497 -5 | 731 13 | 766 -18 | 158 60 | 85 29 | 73 31 |
| 2015-16 | 1,909 254 | 1,731 234 | 787 56 | 944 178 | 178 20 | 103 18 | 75 2 |
| 2016-17 | 1,964 55 | 1,826 95 | 865 78 | 961 17 | 138 -40 | 89 -14 | 49 -26 |
| 2017-18 | 2,064 100 | 1,880 54 | 928 63 | 952 -9 | 184 46 | 94 5 | 90 41 |
| 2018-19 | 2,253 189 | 2,047 167 | 976 48 | 1,071 119 | 206 22 | 102 8 | 104 14 |
| 2019-20 | 2,238 -15 | 2,030 -17 | 946 -30 | 1,084 13 | 208 2 | 92 -10 | 116 12 |
| 2020-21 | 2,037 -201 | 1,892 -138 | 907 -39 | 985 -99 | 145 -63 | 71 -21 | 74 -42 |
| 2021-22 | 1,980 -57 | 1,836 -56 | 858 -49 | 978 -7 | 144 -1 | 69 -2 | 75 1 |
| 2022-23 | 1,958 -22 | 1,829 -7 | 888 30 | 941 -37 | 129 -15 | 56 -13 | 73 -2 |
| Average | 1,947 | 1,793 | 854 | 938 | 154 | 79 | 75 |