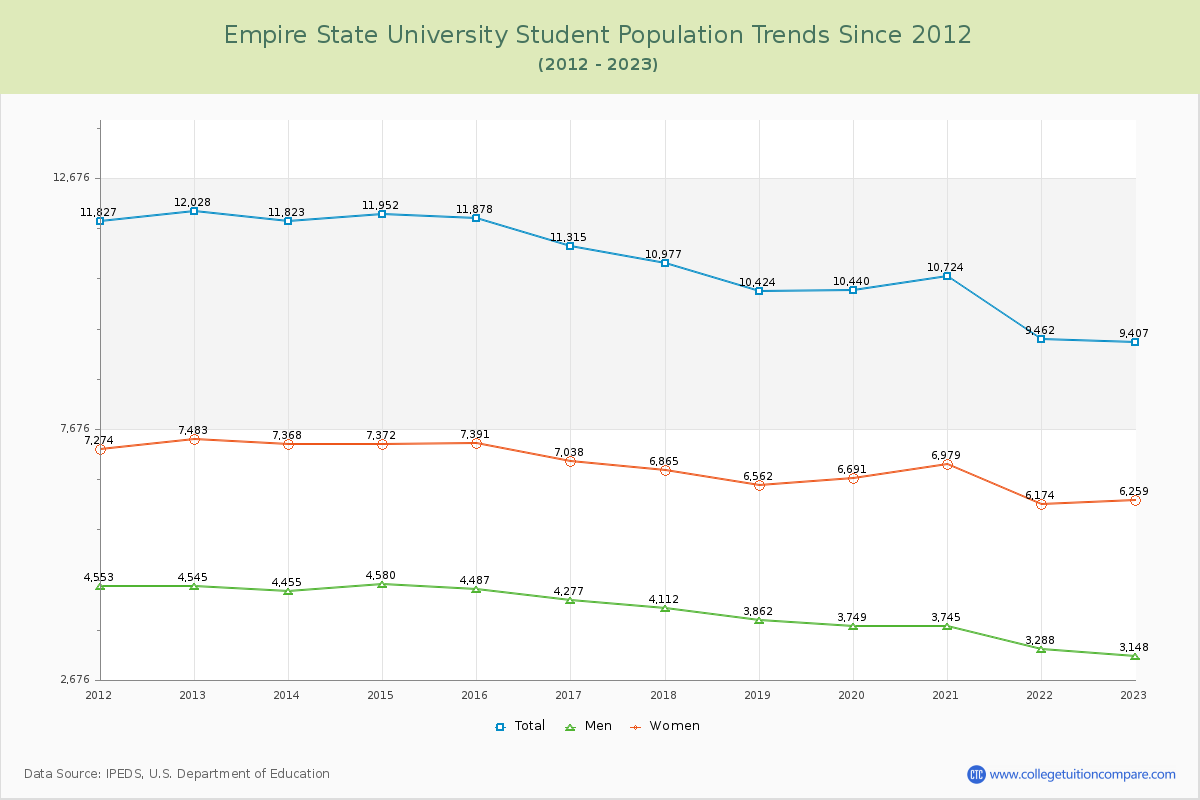
Student Population Changes
The average student population over the last 12 years is 10,948 where 9,407 students are attending the school for the academic year 2022-2023.
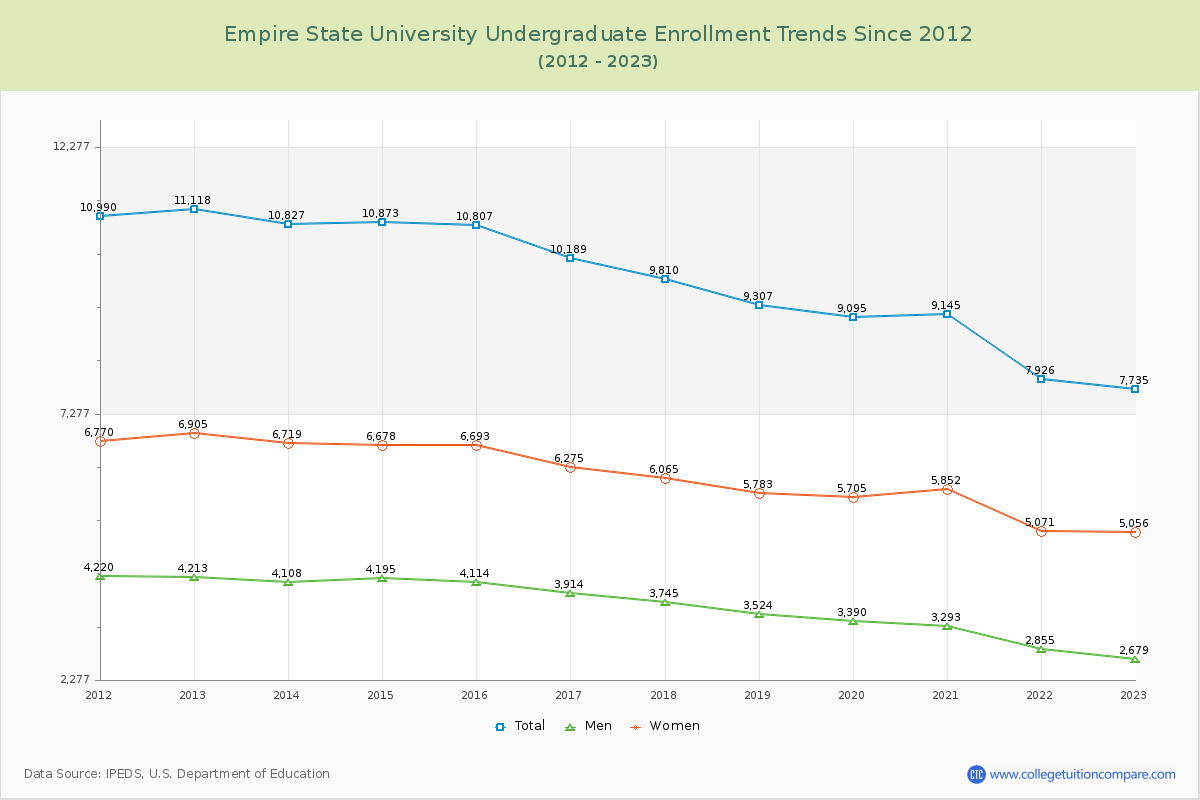
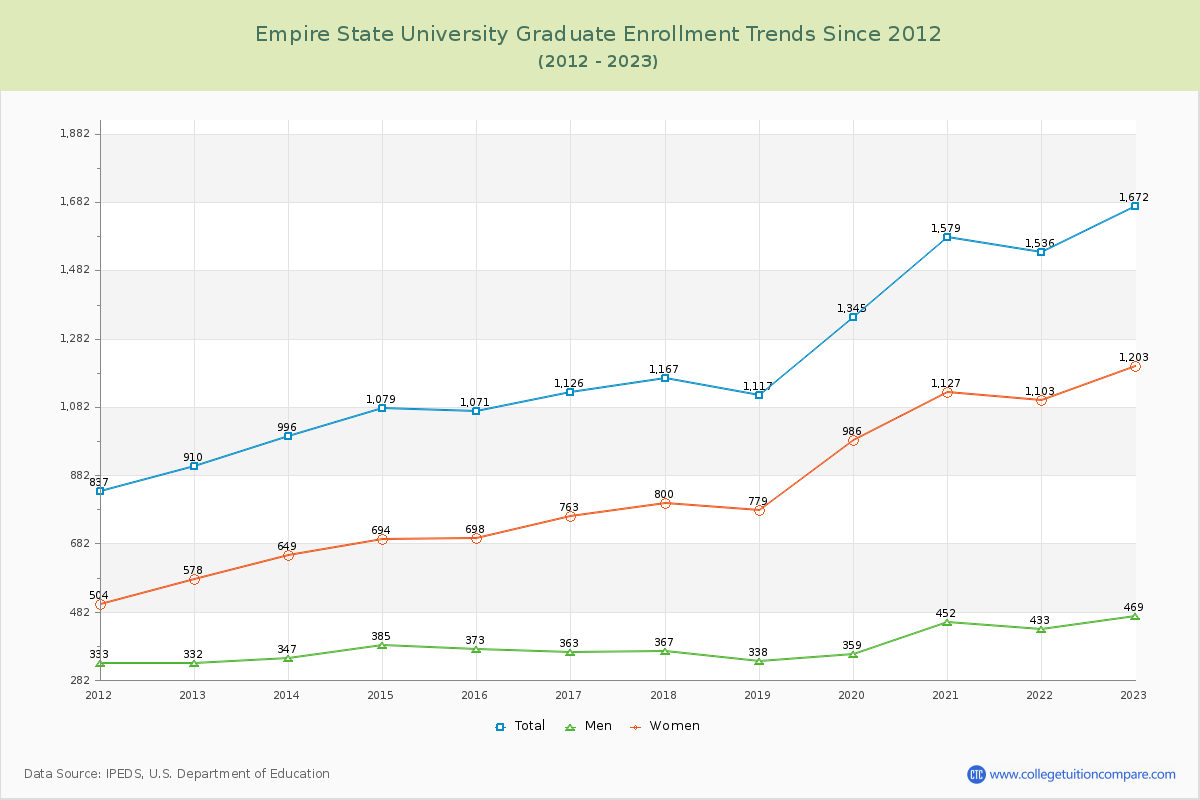
82.23% of total students is undergraduate students and 17.77% students is graduate students. The number of undergraduate students has decreased by 3,383 and the graduate enrollment has increased by 762 over past 10 years.
The female to male ratio is 1.99 to 1 and it means that there are more female students enrolled in Empire State than male students.
The following table and chart illustrate the changes in student population by gender at Empire State University since 2012.
| Year | Total | Undergraduate | Graduate | ||||
|---|---|---|---|---|---|---|---|
| Total | Men | Women | Total | Men | Women | ||
| 2012-13 | 12,028 | 11,118 | 4,213 | 6,905 | 910 | 332 | 578 |
| 2013-14 | 11,823 -205 | 10,827 -291 | 4,108 -105 | 6,719 -186 | 996 86 | 347 15 | 649 71 |
| 2014-15 | 11,952 129 | 10,873 46 | 4,195 87 | 6,678 -41 | 1,079 83 | 385 38 | 694 45 |
| 2015-16 | 11,878 -74 | 10,807 -66 | 4,114 -81 | 6,693 15 | 1,071 -8 | 373 -12 | 698 4 |
| 2016-17 | 11,315 -563 | 10,189 -618 | 3,914 -200 | 6,275 -418 | 1,126 55 | 363 -10 | 763 65 |
| 2017-18 | 10,977 -338 | 9,810 -379 | 3,745 -169 | 6,065 -210 | 1,167 41 | 367 4 | 800 37 |
| 2018-19 | 10,424 -553 | 9,307 -503 | 3,524 -221 | 5,783 -282 | 1,117 -50 | 338 -29 | 779 -21 |
| 2019-20 | 10,440 16 | 9,095 -212 | 3,390 -134 | 5,705 -78 | 1,345 228 | 359 21 | 986 207 |
| 2020-21 | 10,724 284 | 9,145 50 | 3,293 -97 | 5,852 147 | 1,579 234 | 452 93 | 1,127 141 |
| 2021-22 | 9,462 -1,262 | 7,926 -1,219 | 2,855 -438 | 5,071 -781 | 1,536 -43 | 433 -19 | 1,103 -24 |
| 2022-23 | 9,407 -55 | 7,735 -191 | 2,679 -176 | 5,056 -15 | 1,672 136 | 469 36 | 1,203 100 |
| Average | 10,948 | 9,712 | 3,639 | 6,073 | 1,236 | 383 | 853 |