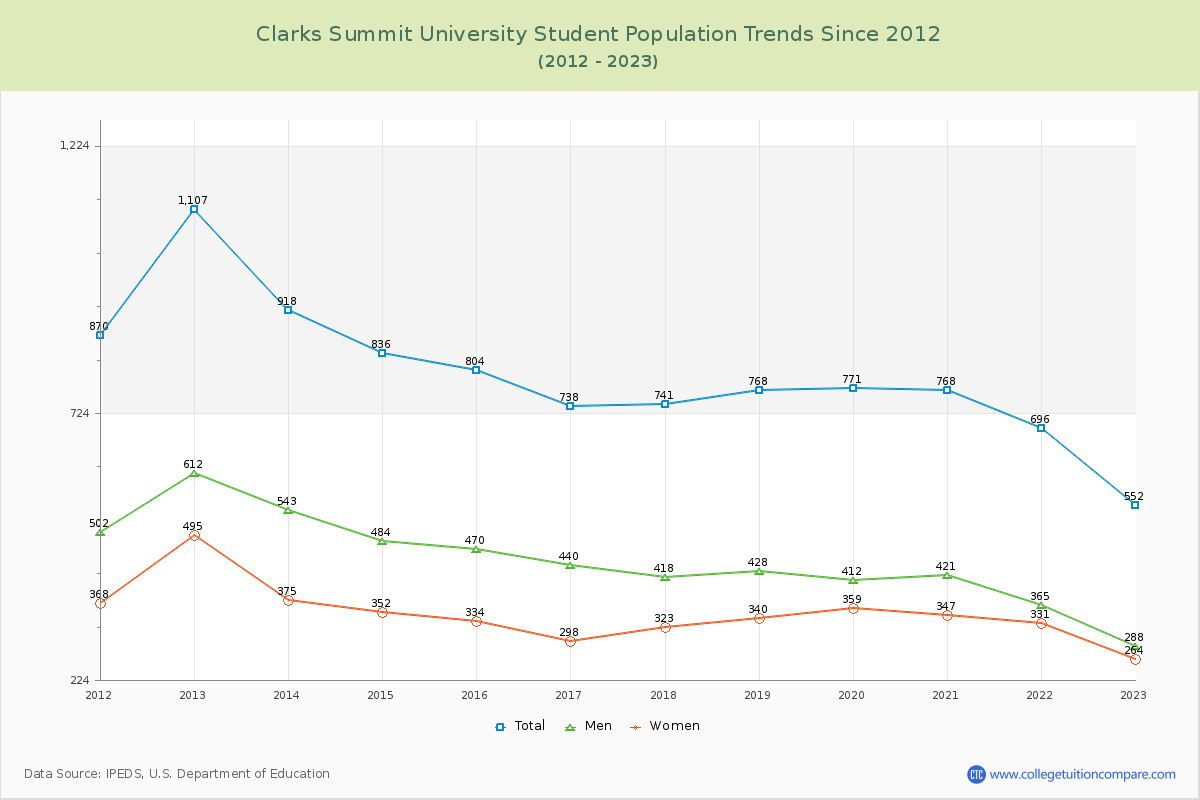
Student Population Changes
The average student population over the last 12 years is 791 where 552 students are attending the school for the academic year 2022-2023.
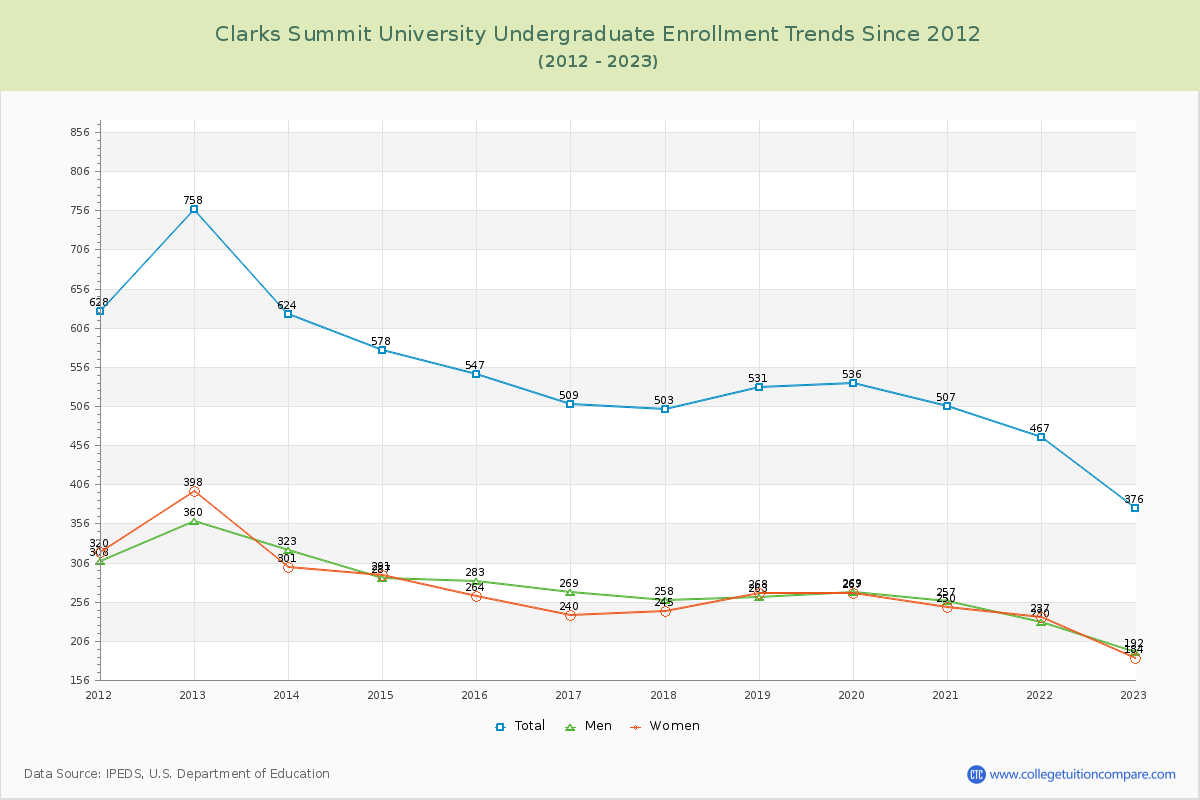
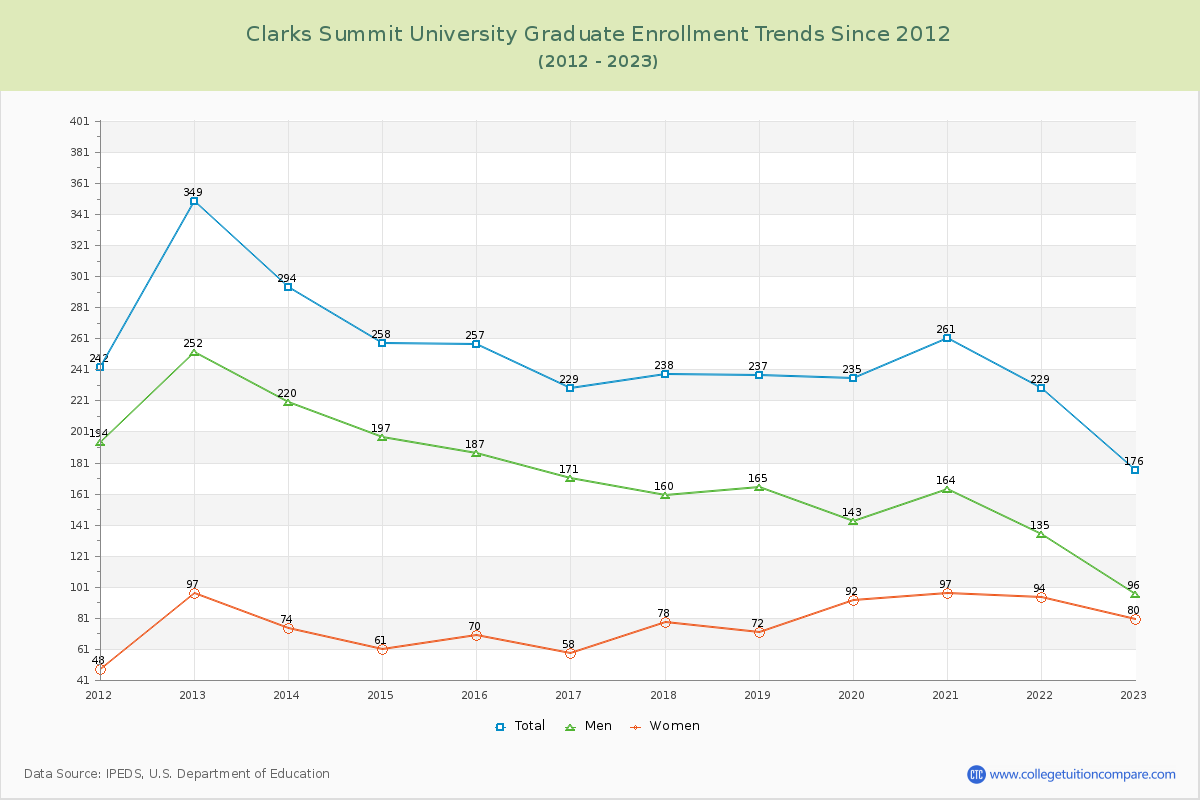
68.12% of total students is undergraduate students and 31.88% students is graduate students. The number of undergraduate students has decreased by 382 and the graduate enrollment has decreased by 173 over past 10 years.
The female to male ratio is 0.92 to 1 and it means that there are similar numbers of female and male students enrolled in Clarks Summit.
The following table and chart illustrate the changes in student population by gender at Clarks Summit University since 2012.
| Year | Total | Undergraduate | Graduate | ||||
|---|---|---|---|---|---|---|---|
| Total | Men | Women | Total | Men | Women | ||
| 2012-13 | 1,107 | 758 | 360 | 398 | 349 | 252 | 97 |
| 2013-14 | 918 -189 | 624 -134 | 323 -37 | 301 -97 | 294 -55 | 220 -32 | 74 -23 |
| 2014-15 | 836 -82 | 578 -46 | 287 -36 | 291 -10 | 258 -36 | 197 -23 | 61 -13 |
| 2015-16 | 804 -32 | 547 -31 | 283 -4 | 264 -27 | 257 -1 | 187 -10 | 70 9 |
| 2016-17 | 738 -66 | 509 -38 | 269 -14 | 240 -24 | 229 -28 | 171 -16 | 58 -12 |
| 2017-18 | 741 3 | 503 -6 | 258 -11 | 245 5 | 238 9 | 160 -11 | 78 20 |
| 2018-19 | 768 27 | 531 28 | 263 5 | 268 23 | 237 -1 | 165 5 | 72 -6 |
| 2019-20 | 771 3 | 536 5 | 269 6 | 267 -1 | 235 -2 | 143 -22 | 92 20 |
| 2020-21 | 768 -3 | 507 -29 | 257 -12 | 250 -17 | 261 26 | 164 21 | 97 5 |
| 2021-22 | 696 -72 | 467 -40 | 230 -27 | 237 -13 | 229 -32 | 135 -29 | 94 -3 |
| 2022-23 | 552 -144 | 376 -91 | 192 -38 | 184 -53 | 176 -53 | 96 -39 | 80 -14 |
| Average | 791 | 540 | 272 | 268 | 251 | 172 | 79 |