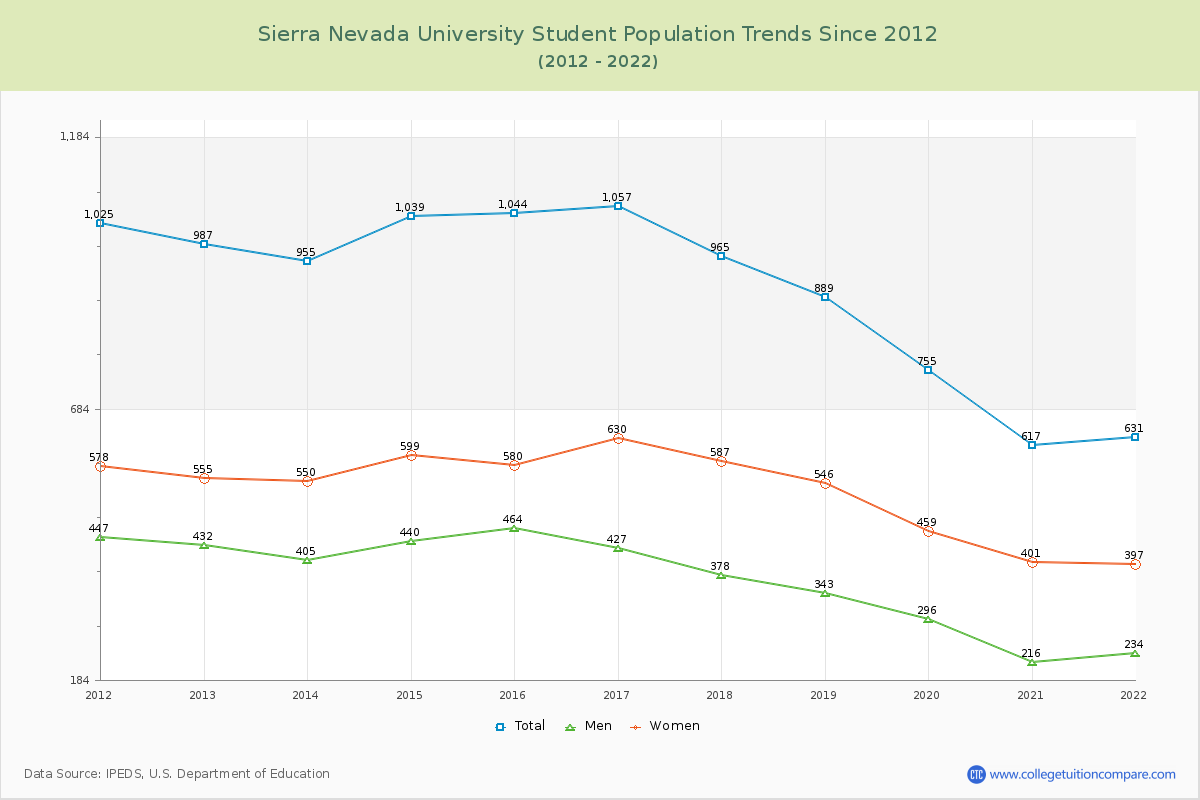
Student Population Changes
The average student population over the last 11 years is 894 where 631 students are attending the school for the academic year 2021-2022.
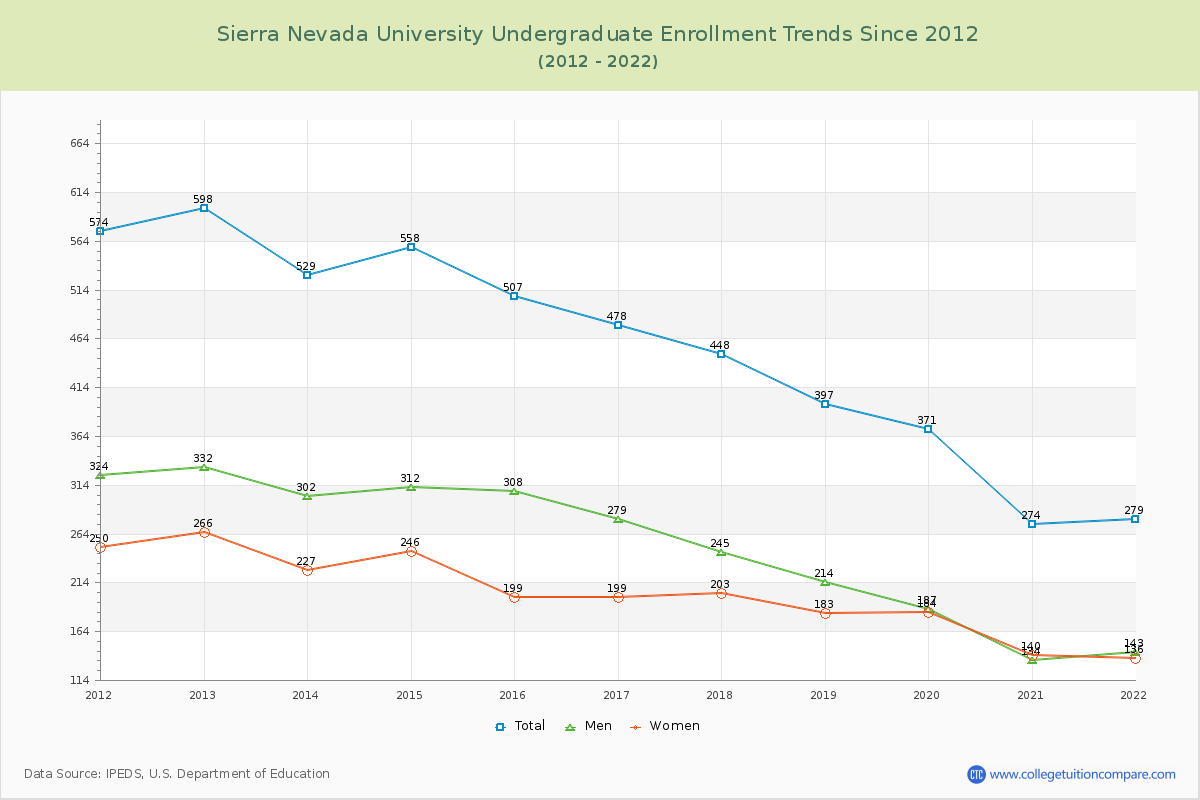
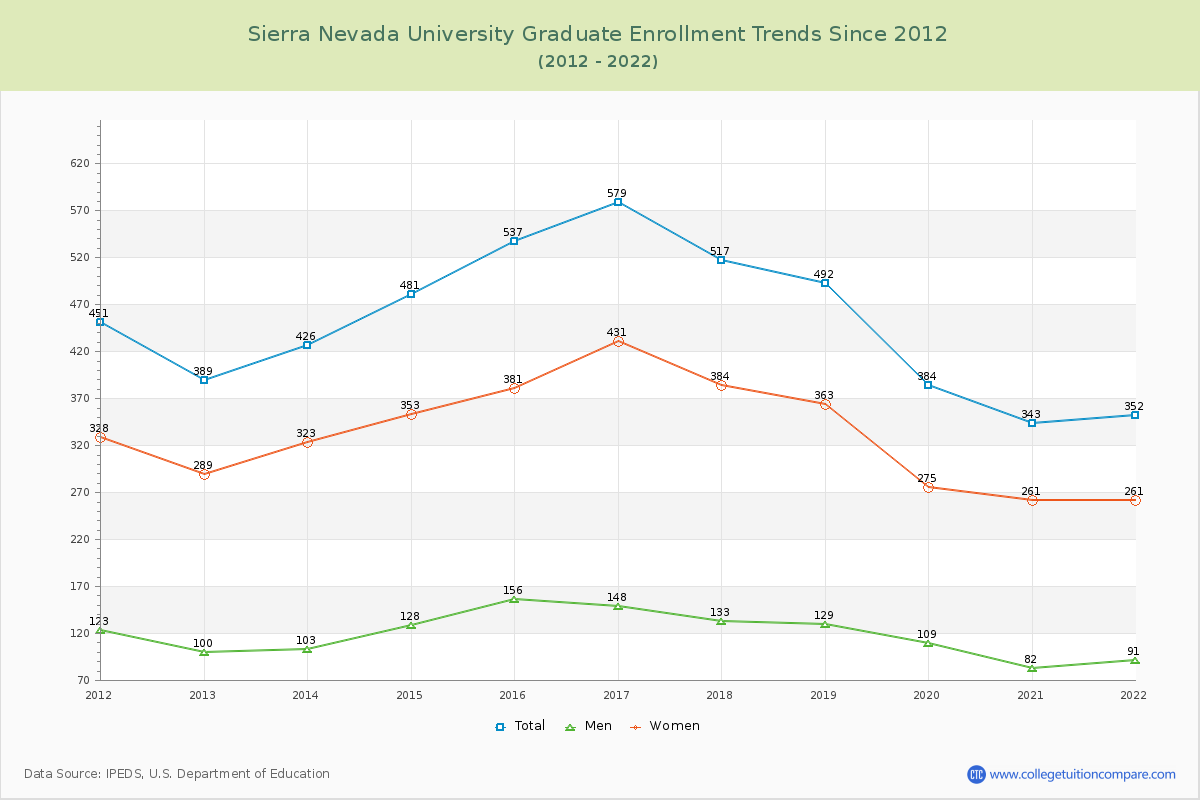
44.22% of total students is undergraduate students and 55.78% students is graduate students. The number of undergraduate students has decreased by 319 and the graduate enrollment has decreased by 37 over past 10 years.
The female to male ratio is 1.70 to 1 and it means that there are more female students enrolled in SNC than male students.
The following table and chart illustrate the changes in student population by gender at Sierra Nevada University since 2012.
| Year | Total | Undergraduate | Graduate | ||||
|---|---|---|---|---|---|---|---|
| Total | Men | Women | Total | Men | Women | ||
| 2012-13 | 987 | 598 | 332 | 266 | 389 | 100 | 289 |
| 2013-14 | 955 -32 | 529 -69 | 302 -30 | 227 -39 | 426 37 | 103 3 | 323 34 |
| 2014-15 | 1,039 84 | 558 29 | 312 10 | 246 19 | 481 55 | 128 25 | 353 30 |
| 2015-16 | 1,044 5 | 507 -51 | 308 -4 | 199 -47 | 537 56 | 156 28 | 381 28 |
| 2016-17 | 1,057 13 | 478 -29 | 279 -29 | 199 0 | 579 42 | 148 -8 | 431 50 |
| 2017-18 | 965 -92 | 448 -30 | 245 -34 | 203 4 | 517 -62 | 133 -15 | 384 -47 |
| 2018-19 | 889 -76 | 397 -51 | 214 -31 | 183 -20 | 492 -25 | 129 -4 | 363 -21 |
| 2019-20 | 755 -134 | 371 -26 | 187 -27 | 184 1 | 384 -108 | 109 -20 | 275 -88 |
| 2020-21 | 617 -138 | 274 -97 | 134 -53 | 140 -44 | 343 -41 | 82 -27 | 261 -14 |
| 2021-22 | 631 14 | 279 5 | 143 9 | 136 -4 | 352 9 | 91 9 | 261 0 |
| Average | 894 | 444 | 246 | 198 | 450 | 118 | 332 |