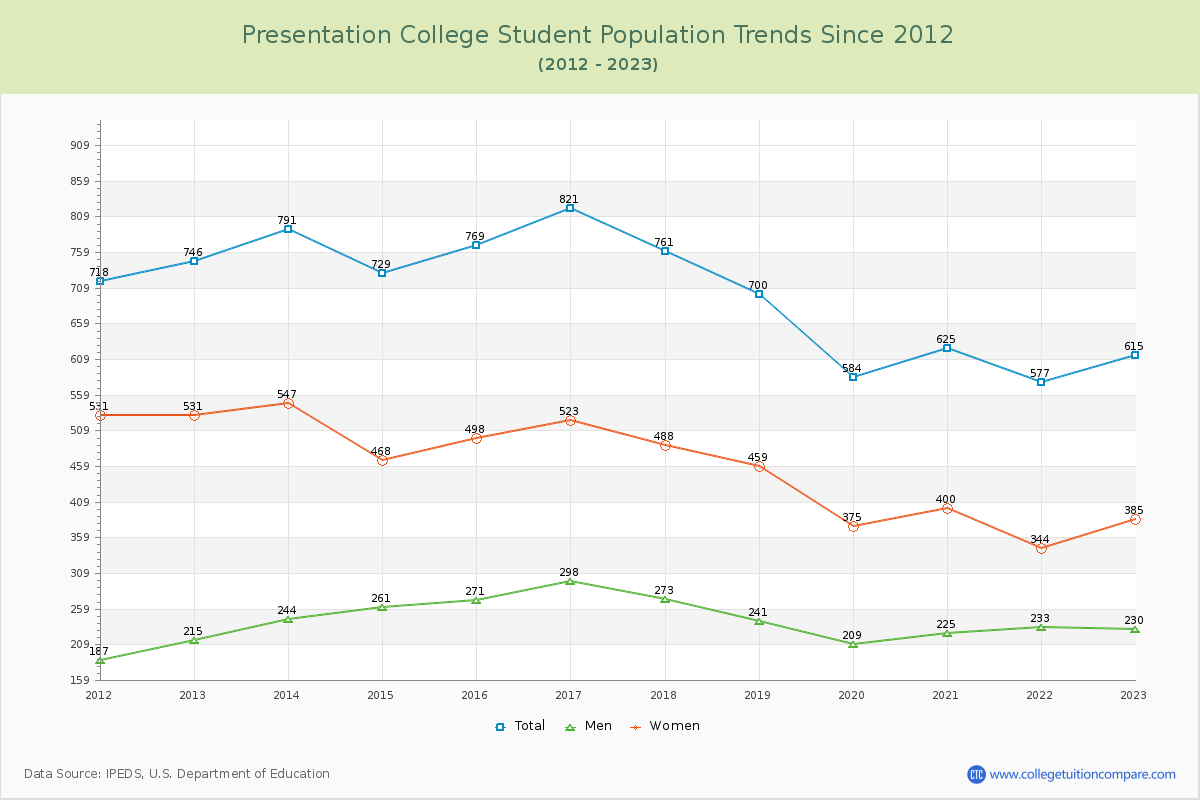
Student Population Changes
The average student population over the last 12 years is 702 where 615 students are attending the school for the academic year 2022-2023.
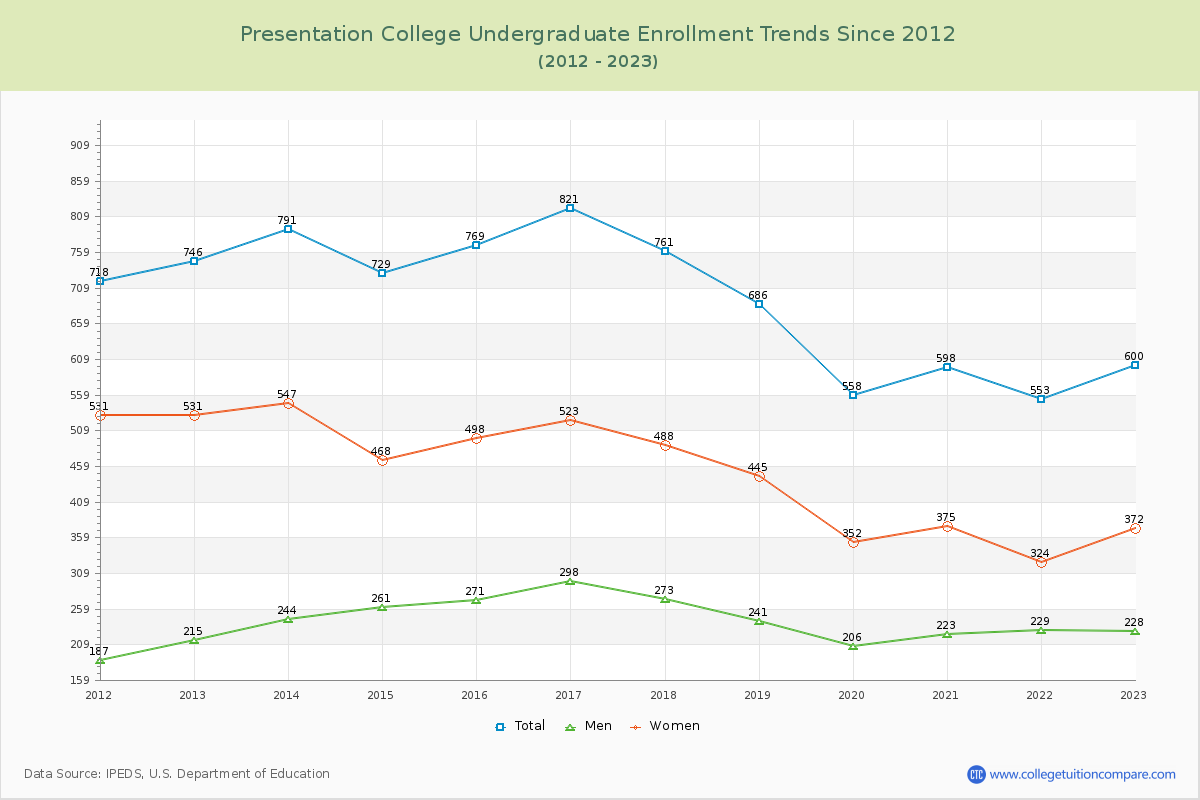
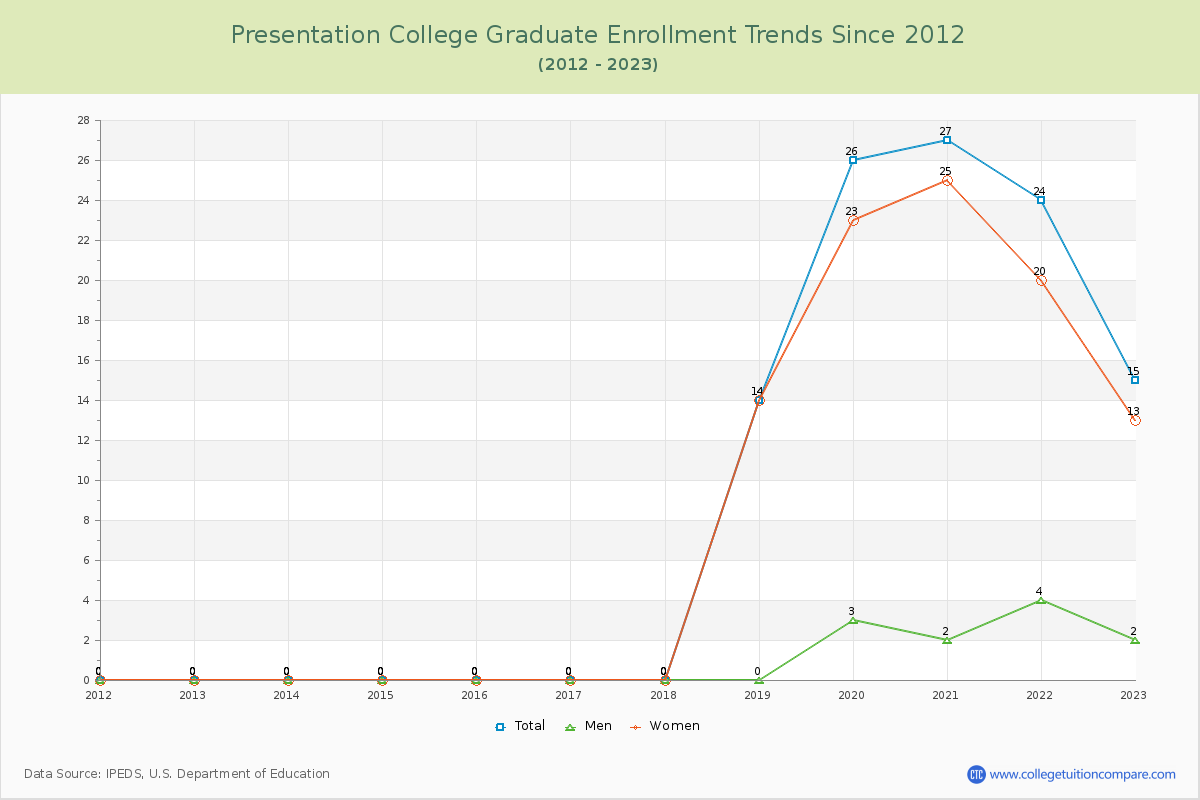
97.56% of total students is undergraduate students and 2.44% students is graduate students. The number of undergraduate students has decreased by 146 and the graduate enrollment has increased by 15 over past 10 years.
The female to male ratio is 1.67 to 1 and it means that there are more female students enrolled in Presentation than male students.
The following table and chart illustrate the changes in student population by gender at Presentation College since 2012.
| Year | Total | Undergraduate | Graduate | ||||
|---|---|---|---|---|---|---|---|
| Total | Men | Women | Total | Men | Women | ||
| 2012-13 | 746 | 746 | 215 | 531 | 0 | 0 | 0 |
| 2013-14 | 791 45 | 791 45 | 244 29 | 547 16 | 0 0 | 0 0 | 0 0 |
| 2014-15 | 729 -62 | 729 -62 | 261 17 | 468 -79 | 0 0 | 0 0 | 0 0 |
| 2015-16 | 769 40 | 769 40 | 271 10 | 498 30 | 0 0 | 0 0 | 0 0 |
| 2016-17 | 821 52 | 821 52 | 298 27 | 523 25 | 0 0 | 0 0 | 0 0 |
| 2017-18 | 761 -60 | 761 -60 | 273 -25 | 488 -35 | 0 0 | 0 0 | 0 0 |
| 2018-19 | 700 -61 | 686 -75 | 241 -32 | 445 -43 | 14 14 | 0 0 | 14 14 |
| 2019-20 | 584 -116 | 558 -128 | 206 -35 | 352 -93 | 26 12 | 3 3 | 23 9 |
| 2020-21 | 625 41 | 598 40 | 223 17 | 375 23 | 27 1 | 2 -1 | 25 2 |
| 2021-22 | 577 -48 | 553 -45 | 229 6 | 324 -51 | 24 -3 | 4 2 | 20 -5 |
| 2022-23 | 615 38 | 600 47 | 228 -1 | 372 48 | 15 -9 | 2 -2 | 13 -7 |
| Average | 702 | 692 | 244 | 448 | 10 | 1 | 9 |