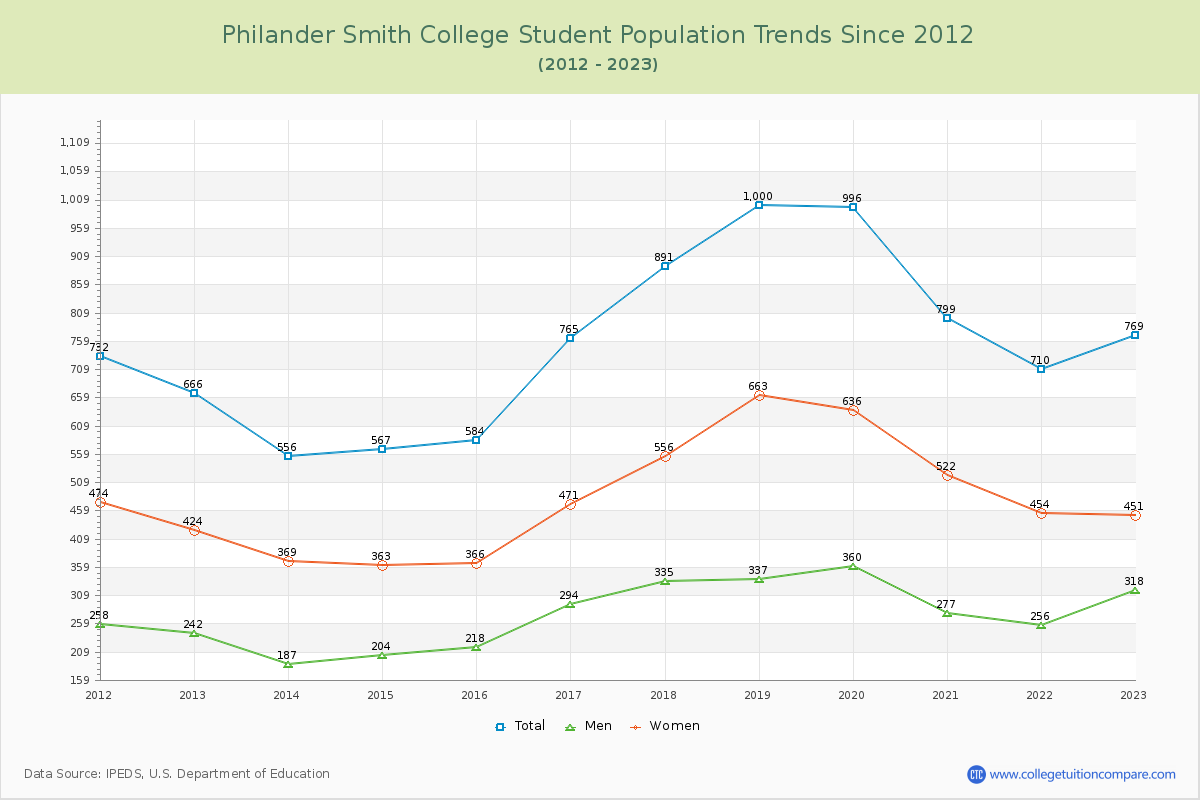
Student Population Changes
The average student population over the last 12 years is 755 where 769 students are attending the school for the academic year 2022-2023.
The female to male ratio is 1.42 to 1 and it means that there are more female students enrolled in PSC than male students.
The following table and chart illustrate the changes in student population by gender at Philander Smith College since 2012.
| Year | Total | Men | Women |
|---|---|---|---|
| 2012-13 | 666 | 242 | 424 |
| 2013-14 | 556 -110 | 187 -55 | 369 -55 |
| 2014-15 | 567 11 | 204 17 | 363 -6 |
| 2015-16 | 584 17 | 218 14 | 366 3 |
| 2016-17 | 765 181 | 294 76 | 471 105 |
| 2017-18 | 891 126 | 335 41 | 556 85 |
| 2018-19 | 1,000 109 | 337 2 | 663 107 |
| 2019-20 | 996 -4 | 360 23 | 636 -27 |
| 2020-21 | 799 -197 | 277 -83 | 522 -114 |
| 2021-22 | 710 -89 | 256 -21 | 454 -68 |
| 2022-23 | 769 59 | 318 62 | 451 -3 |
| Average | 755 | 275 | 480 |