Student Population Changes

The average student population over the last 6 years is 435 where 480 students are attending the school for the academic year 2018-2019.
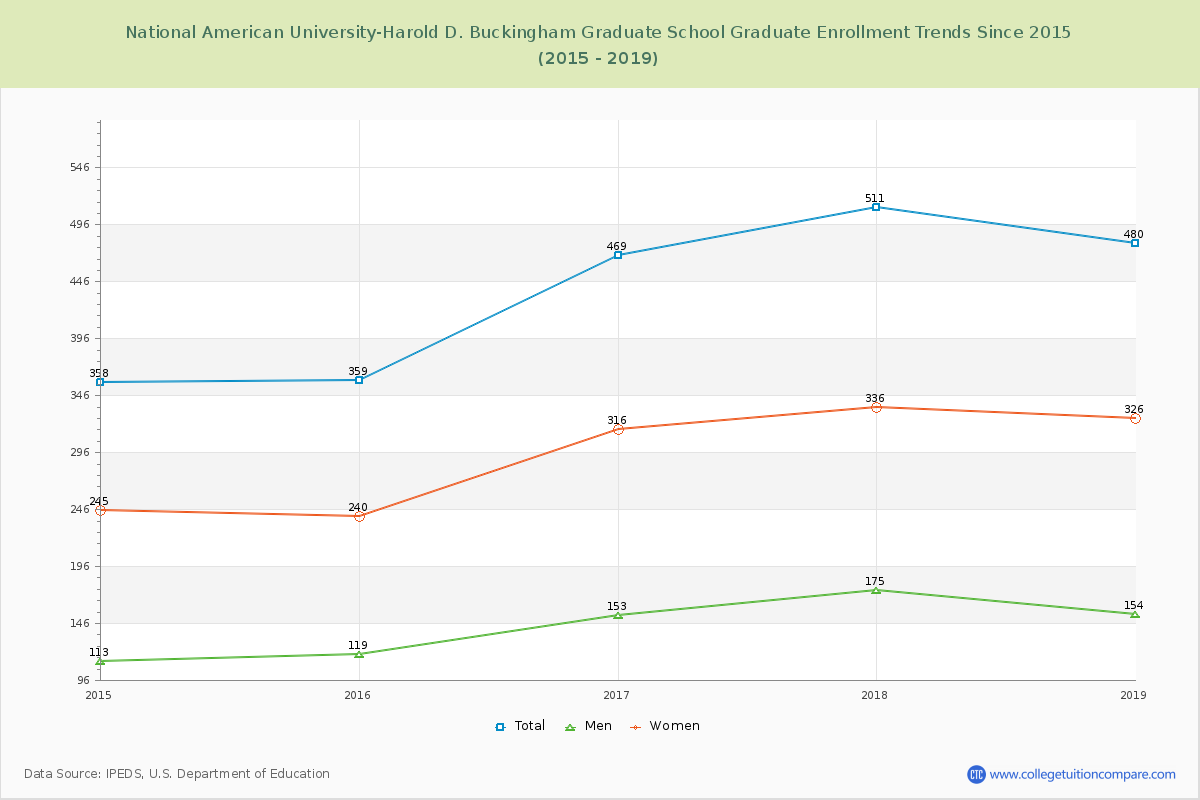
The following table and chart illustrate the changes in student population by gender at National American University-Harold D. Buckingham Graduate School since 2014.
TableInteractive ChartDownloadable Chart
Student Population Changes of National American University-Harold D. Buckingham Graduate School
National American University-Harold D. Buckingham Graduate School Enrollment Trends Chart

Enrollment by Race/Ethnicity Changes

The percentage of white students is 44.38% and the percentage of black students is 23.96% at National American University-Harold D. Buckingham Graduate School. 4.38% of enrolled students is Asian.
The following table and chart illustrate the student population trends by race/ethnicity at National American University-Harold D. Buckingham Graduate School over the past 6 years (2014-2019).
TableInteractive ChartDownloadable Chart
Enrollment by Race/Ethnicity Changes of National American University-Harold D. Buckingham Graduate School
National American University-Harold D. Buckingham Graduate School Enrollment by Race Trends Chart

Distance Learning (Online Courses) Enrollment Changes

479 students are enrolled in online degree programs exclusively for the academic year 2018-2019, which is 100% of total students. The number of online students has increased 60.74% since 2014. The following table and chart illustrate the changes in the online student population by enrolled type at National American University-Harold D. Buckingham Graduate School from 2014 to 2019.
TableChart
Distance Learning (Online Courses) Enrollment Changes of National American University-Harold D. Buckingham Graduate School

Compare National American University-Harold D. Buckingham Graduate School in a Variety of Ways

Related Articles and Ads