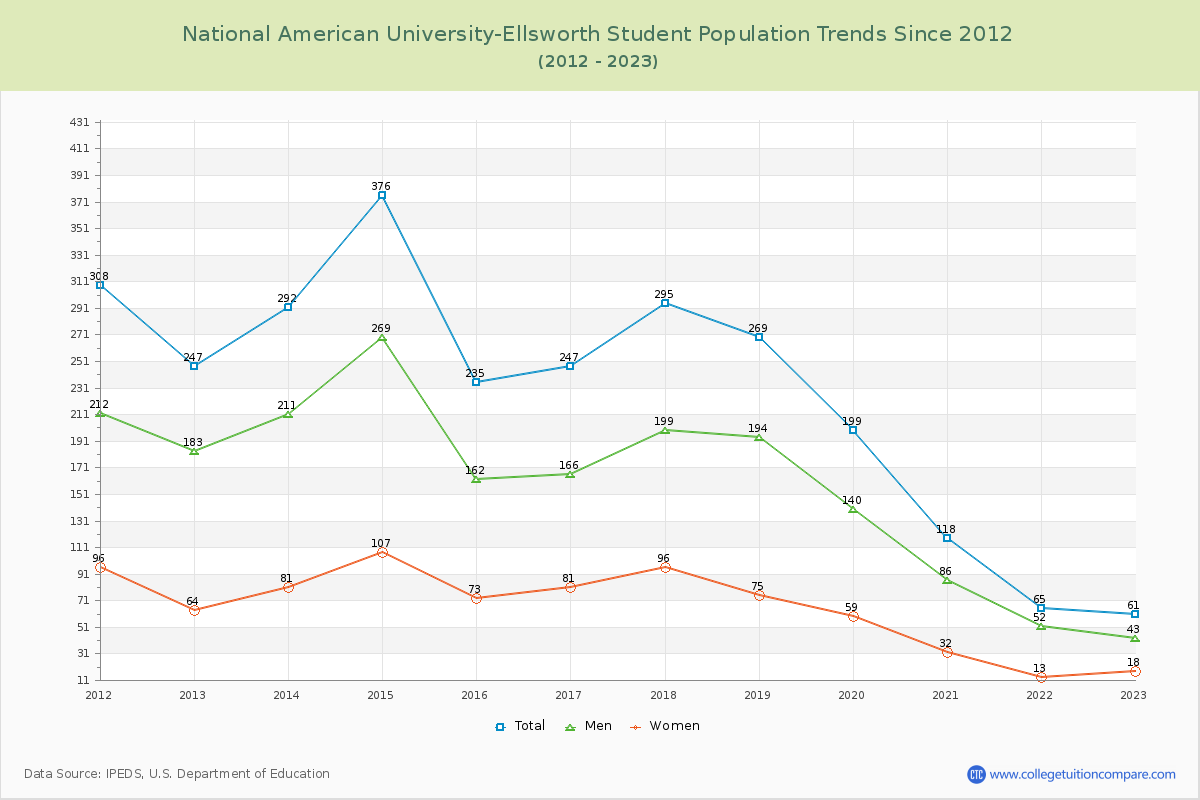
Student Population Changes
The average student population over the last 12 years is 219 where 61 students are attending the school for the academic year 2022-2023.
The female to male ratio is 0.42 to 1 and it means that there are far more male students enrolled in National American University-Ellsworth than female students.
The following table and chart illustrate the changes in student population by gender at National American University-Ellsworth since 2012.
| Year | Total | Men | Women |
|---|---|---|---|
| 2012-13 | 247 | 183 | 64 |
| 2013-14 | 292 45 | 211 28 | 81 17 |
| 2014-15 | 376 84 | 269 58 | 107 26 |
| 2015-16 | 235 -141 | 162 -107 | 73 -34 |
| 2016-17 | 247 12 | 166 4 | 81 8 |
| 2017-18 | 295 48 | 199 33 | 96 15 |
| 2018-19 | 269 -26 | 194 -5 | 75 -21 |
| 2019-20 | 199 -70 | 140 -54 | 59 -16 |
| 2020-21 | 118 -81 | 86 -54 | 32 -27 |
| 2021-22 | 65 -53 | 52 -34 | 13 -19 |
| 2022-23 | 61 -4 | 43 -9 | 18 5 |
| Average | 219 | 155 | 64 |