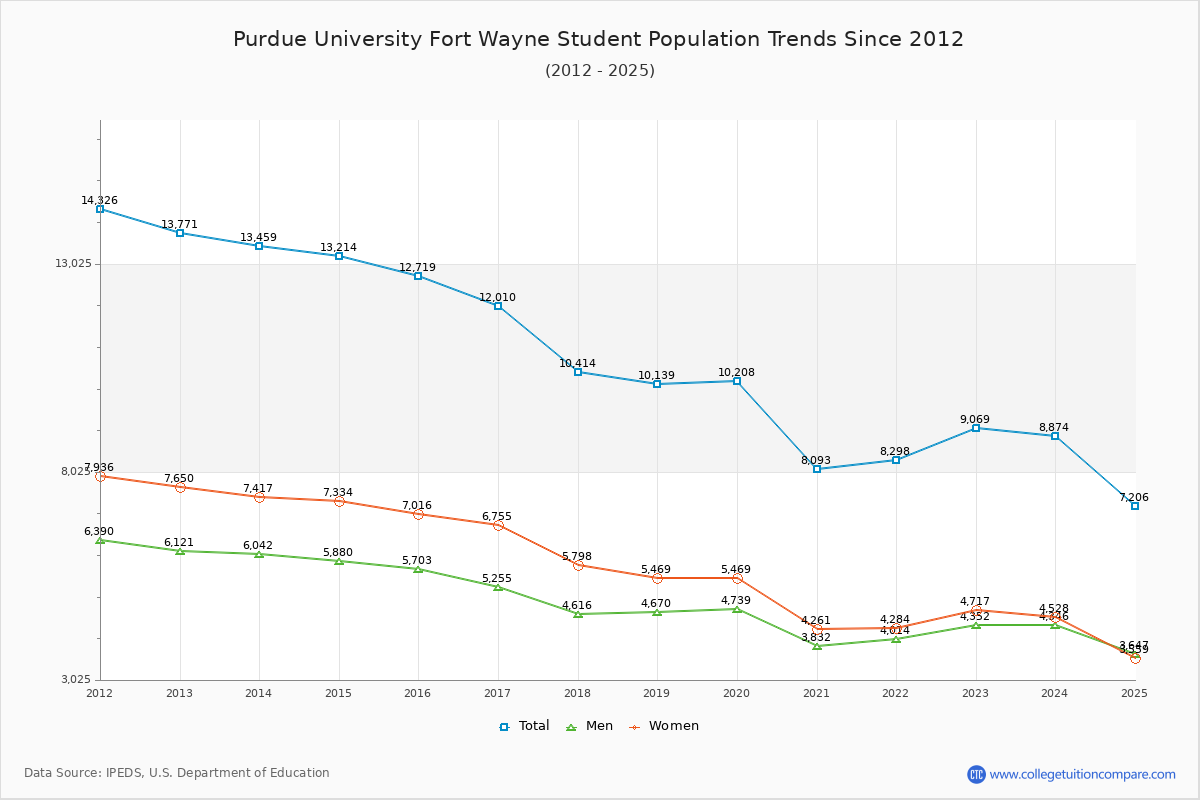
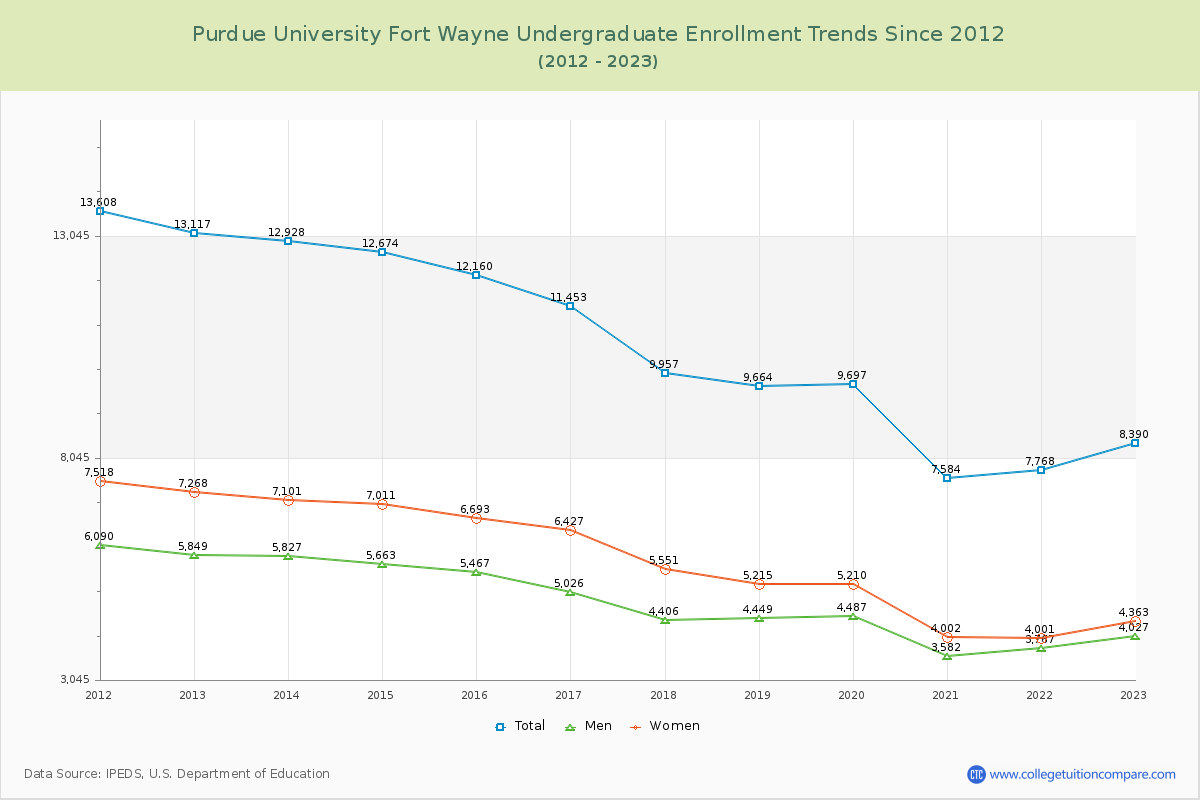
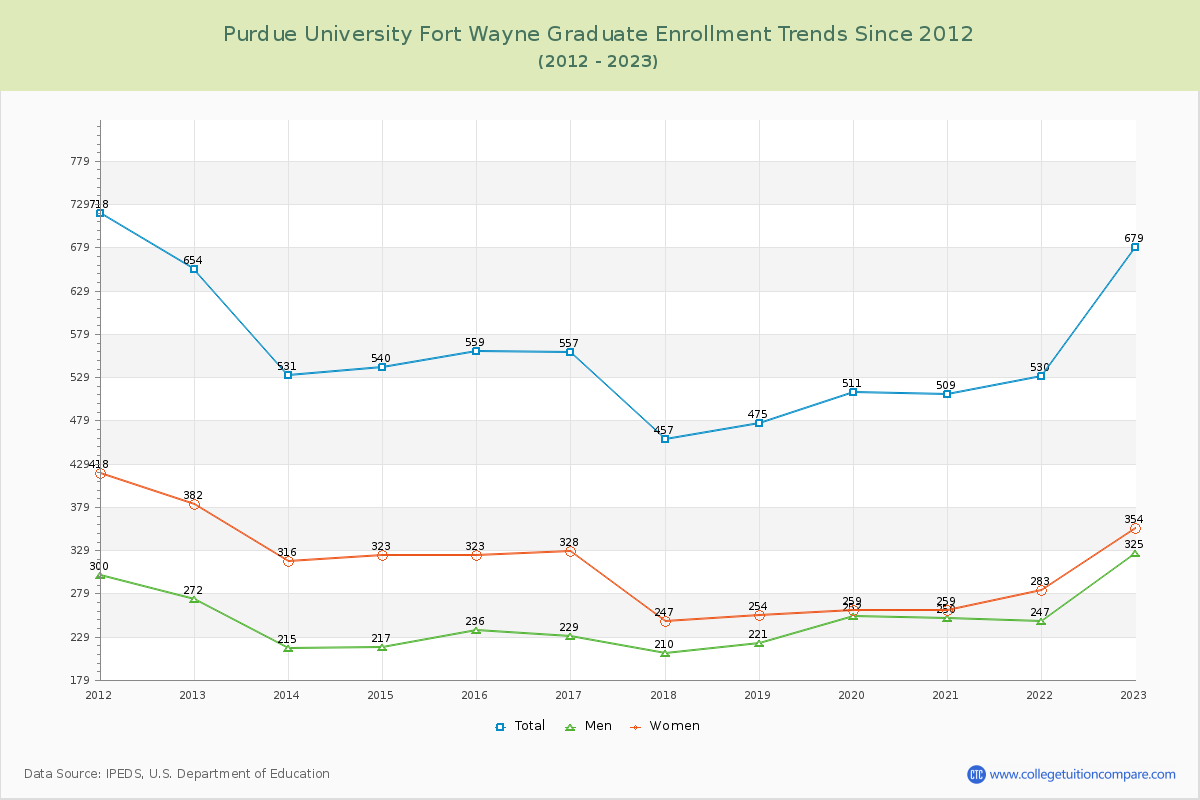
Student Population Changes
The average student population over the last 12 years is 11,036 where 9,069 students are attending the school for the academic year 2022-2023.
92.51% of total students is undergraduate students and 7.49% students is graduate students. The number of undergraduate students has decreased by 4,727 and the graduate enrollment has increased by 25 over past 10 years.
The female to male ratio is 1.08 to 1 and it means that there are similar numbers of female and male students enrolled in IPFW.
The following table and chart illustrate the changes in student population by gender at Purdue University Fort Wayne since 2012.
| Year | Total | Undergraduate | Graduate | ||||
|---|---|---|---|---|---|---|---|
| Total | Men | Women | Total | Men | Women | ||
| 2012-13 | 13,771 | 13,117 | 5,849 | 7,268 | 654 | 272 | 382 |
| 2013-14 | 13,459 -312 | 12,928 -189 | 5,827 -22 | 7,101 -167 | 531 -123 | 215 -57 | 316 -66 |
| 2014-15 | 13,214 -245 | 12,674 -254 | 5,663 -164 | 7,011 -90 | 540 9 | 217 2 | 323 7 |
| 2015-16 | 12,719 -495 | 12,160 -514 | 5,467 -196 | 6,693 -318 | 559 19 | 236 19 | 323 0 |
| 2016-17 | 12,010 -709 | 11,453 -707 | 5,026 -441 | 6,427 -266 | 557 -2 | 229 -7 | 328 5 |
| 2017-18 | 10,414 -1,596 | 9,957 -1,496 | 4,406 -620 | 5,551 -876 | 457 -100 | 210 -19 | 247 -81 |
| 2018-19 | 10,139 -275 | 9,664 -293 | 4,449 43 | 5,215 -336 | 475 18 | 221 11 | 254 7 |
| 2019-20 | 10,208 69 | 9,697 33 | 4,487 38 | 5,210 -5 | 511 36 | 252 31 | 259 5 |
| 2020-21 | 8,093 -2,115 | 7,584 -2,113 | 3,582 -905 | 4,002 -1,208 | 509 -2 | 250 -2 | 259 0 |
| 2021-22 | 8,298 205 | 7,768 184 | 3,767 185 | 4,001 -1 | 530 21 | 247 -3 | 283 24 |
| 2022-23 | 9,069 771 | 8,390 622 | 4,027 260 | 4,363 362 | 679 149 | 325 78 | 354 71 |
| Average | 11,036 | 10,490 | 4,777 | 5,713 | 546 | 243 | 303 |