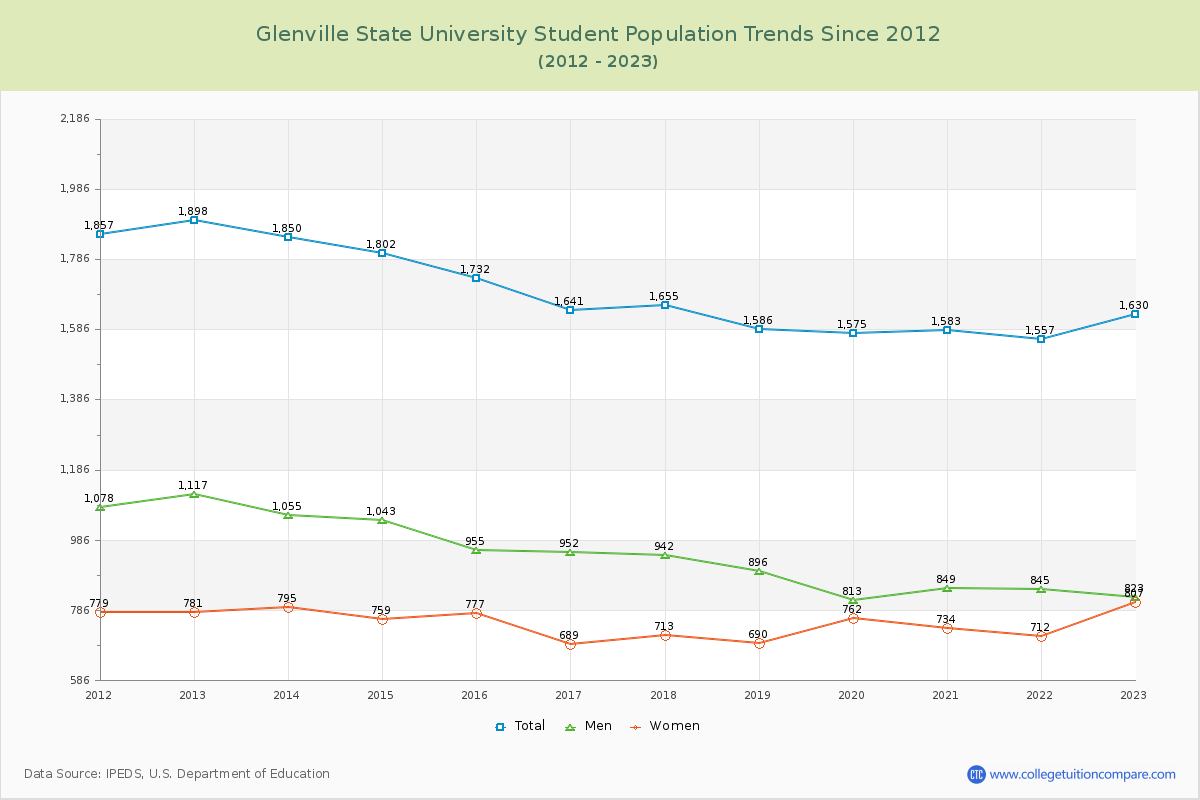
Student Population Changes
The average student population over the last 12 years is 1,683 where 1,630 students are attending the school for the academic year 2022-2023.
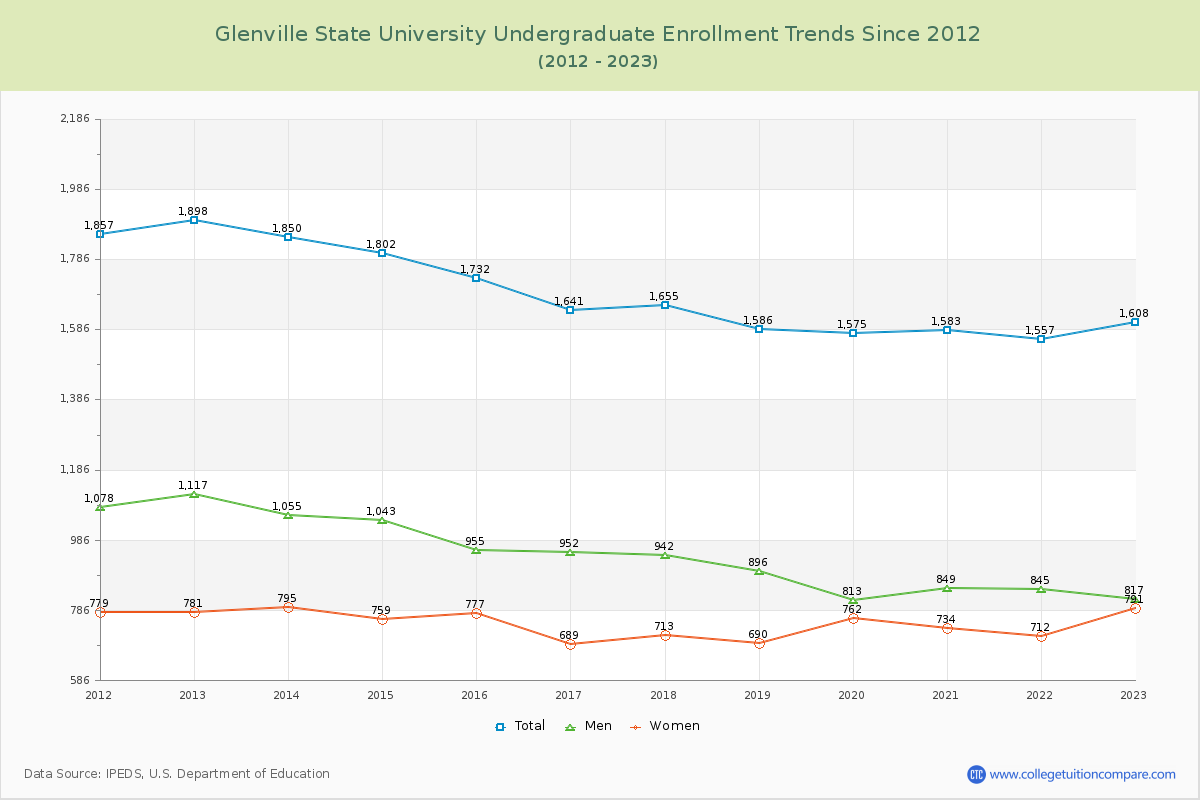
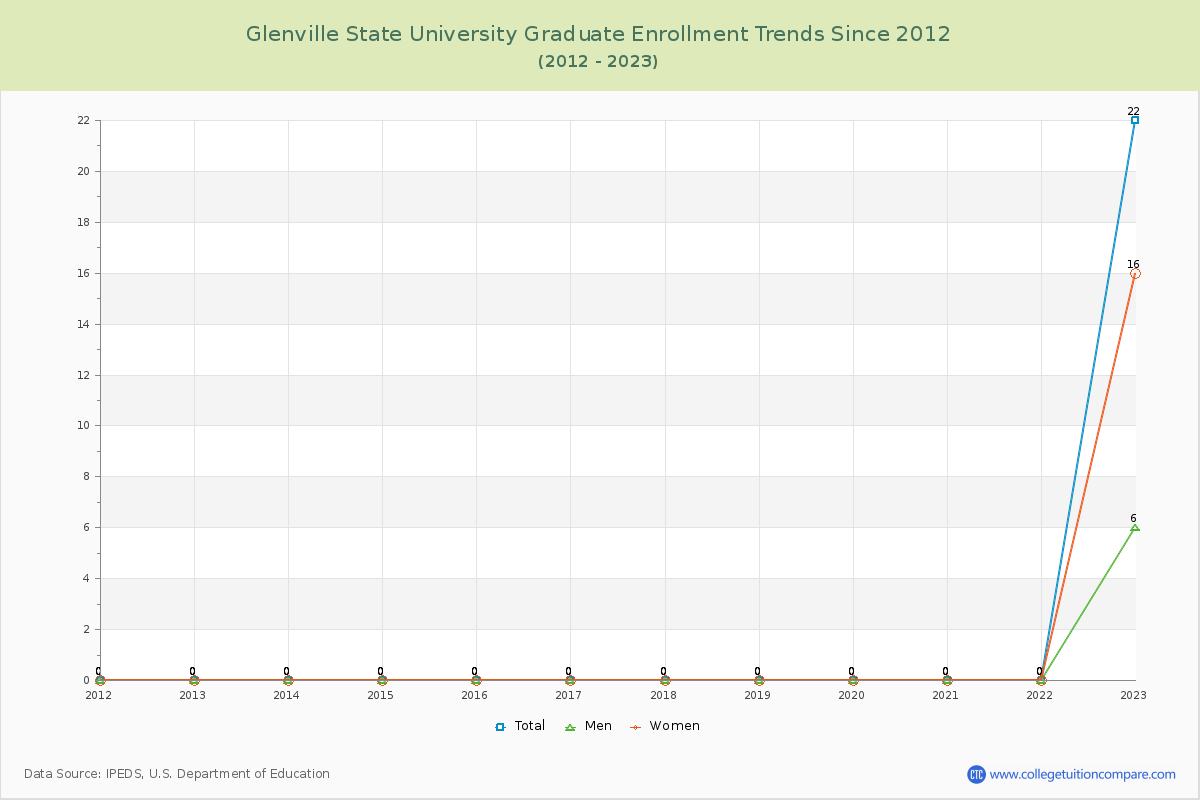
98.65% of total students is undergraduate students and 1.35% students is graduate students. The number of undergraduate students has decreased by 290 and the graduate enrollment has increased by 22 over past 10 years.
The female to male ratio is 0.98 to 1 and it means that there are similar numbers of female and male students enrolled in Glenville State.
The following table and chart illustrate the changes in student population by gender at Glenville State University since 2012.
| Year | Total | Undergraduate | Graduate | ||||
|---|---|---|---|---|---|---|---|
| Total | Men | Women | Total | Men | Women | ||
| 2012-13 | 1,898 | 1,898 | 1,117 | 781 | 0 | 0 | 0 |
| 2013-14 | 1,850 -48 | 1,850 -48 | 1,055 -62 | 795 14 | 0 0 | 0 0 | 0 0 |
| 2014-15 | 1,802 -48 | 1,802 -48 | 1,043 -12 | 759 -36 | 0 0 | 0 0 | 0 0 |
| 2015-16 | 1,732 -70 | 1,732 -70 | 955 -88 | 777 18 | 0 0 | 0 0 | 0 0 |
| 2016-17 | 1,641 -91 | 1,641 -91 | 952 -3 | 689 -88 | 0 0 | 0 0 | 0 0 |
| 2017-18 | 1,655 14 | 1,655 14 | 942 -10 | 713 24 | 0 0 | 0 0 | 0 0 |
| 2018-19 | 1,586 -69 | 1,586 -69 | 896 -46 | 690 -23 | 0 0 | 0 0 | 0 0 |
| 2019-20 | 1,575 -11 | 1,575 -11 | 813 -83 | 762 72 | 0 0 | 0 0 | 0 0 |
| 2020-21 | 1,583 8 | 1,583 8 | 849 36 | 734 -28 | 0 0 | 0 0 | 0 0 |
| 2021-22 | 1,557 -26 | 1,557 -26 | 845 -4 | 712 -22 | 0 0 | 0 0 | 0 0 |
| 2022-23 | 1,630 73 | 1,608 51 | 817 -28 | 791 79 | 22 22 | 6 6 | 16 16 |
| Average | 1,683 | 1,681 | 935 | 746 | 2 | 1 | 1 |