Graduation Rate Changes

The average graduation rate of the last 7 years is 35.17% where the current academic year rate is 33%.
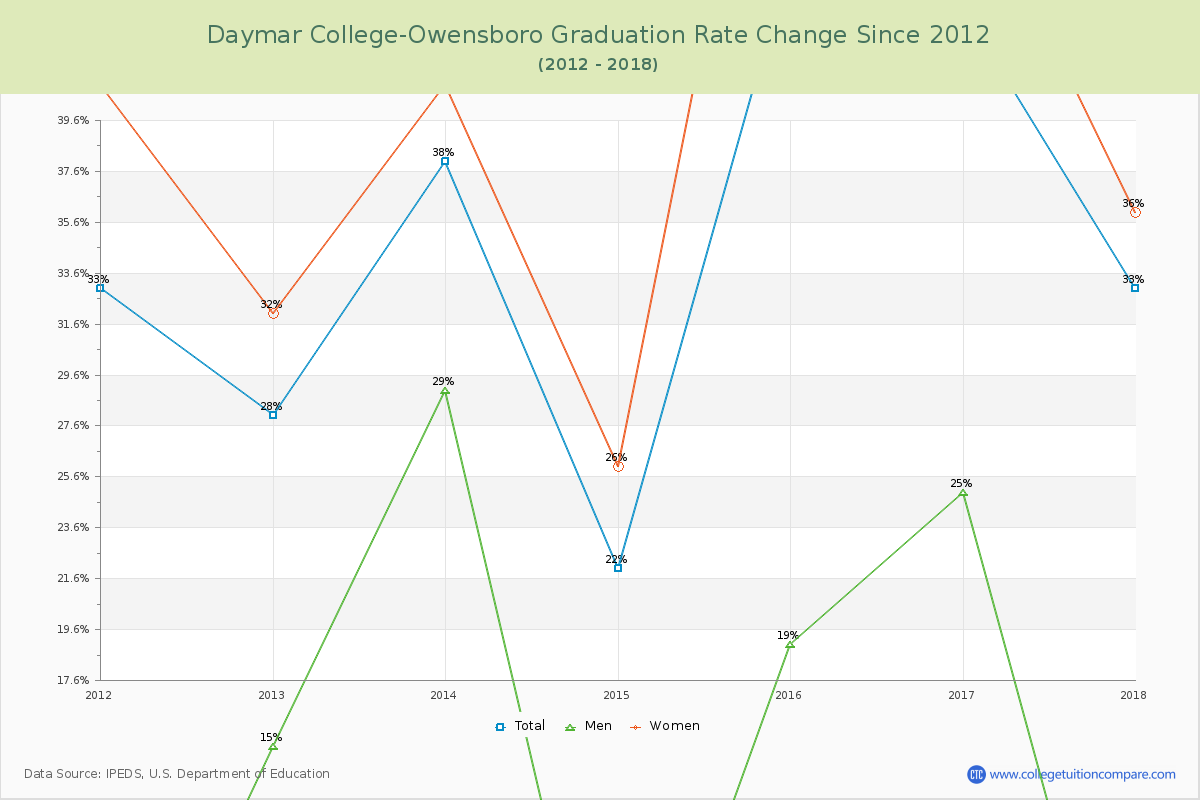
The following table and chart show the changes of graduation rate at Daymar College-Owensboro over the past 7 years (2012-2018).
TableInteractive ChartDownloadable Chart
YearTotalMenWomen
2012-13 28%15%32%
2013-14 38%29%41%
2014-15 22%0%26%
2015-16 46%19%60%
2016-17 44%25%50%
2017-18 33%0%36%
Average35.17%14.67%40.83%
Graduation Rate Changes of Daymar College-Owensboro
Daymar College-Owensboro Graduation Rate Changes Chart

Transfer-out Rate Changes

The average transfer-out rate of the last 7 years is 1.83% where the current year rate is 7%. The following table and chart illustrate the change of transfer-out rate at Daymar College-Owensboro from 2016 to 2018.
TableChart
YearTransfer-out Rate
2016-174%
2017-187%
Average1.83%
Transfer-out Rate Changes of Daymar College-Owensboro

Retention Rate Changes

The average retention rate of the last 7 years is 0.00% (all part-time students).
The following table shows the changes of retention rate at Daymar College-Owensboro from 2012 to 2018.
TableChart
YearFull-timePart-time
2012-13--
2013-14--
2014-15--
2015-16--
2016-17--
2017-18--
Retention Rate Changes of Daymar College-Owensboro

Student to Faculty Ratio Changes

The average student to faculty ratio over the last 7 years is 6.83 to 1 where the current academic year ratio is 3 to 1. The following table and chart illustrate the change of student to faculty ratio at Daymar College-Owensboro since 2018.
TableChart
YearStudent to Faculty Ratio
2012-137:1
2013-145:1
2014-156:1
2015-1612:1
2016-178:1
2017-183:1
Average6.83:1
Student to Faculty Ratio Changes of Daymar College-Owensboro
Related Articles and Ads