Graduation Rate Changes

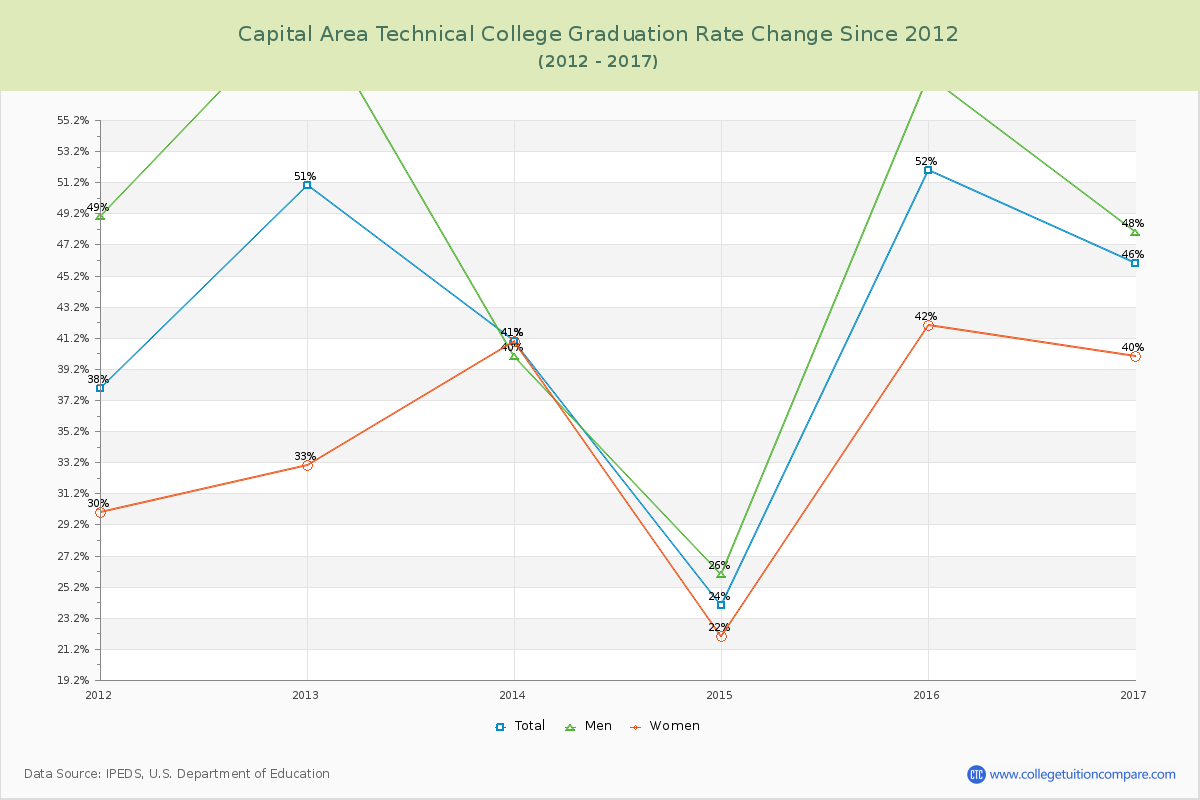
The average graduation rate of the last 6 years is 42.80% where the current academic year rate is 46%.
The following table and chart show the changes of graduation rate at Capital Area Technical College over the past 6 years (2012-2017).
TableInteractive ChartDownloadable Chart
YearTotalMenWomen
2012-13 51%63%33%
2013-14 41%40%41%
2014-15 24%26%22%
2015-16 52%58%42%
2016-17 46%48%40%
Average42.80%47.00%35.60%
Graduation Rate Changes of Capital Area Technical College
Capital Area Technical College Graduation Rate Changes Chart

Transfer-out Rate Changes

The average transfer-out rate of the last 6 years is 5.60% where the current year rate is 15%. The following table and chart illustrate the change of transfer-out rate at Capital Area Technical College from 2013 to 2017.
TableChart
YearTransfer-out Rate
2013-146%
2014-150%
2015-167%
2016-1715%
Average5.60%
Transfer-out Rate Changes of Capital Area Technical College

Retention Rate Changes

The average retention rate of the last 6 years is 52.40% for full-time students and 44.20% for part-time students.
The following table shows the changes of retention rate at Capital Area Technical from 2012 to 2017.
TableChart
YearFull-timePart-time
2012-1349%37%
2013-1447%43%
2014-1543%37%
2015-1662%68%
2016-1761%36%
Average52.40%44.20%
Retention Rate Changes of Capital Area Technical College

Student to Faculty Ratio Changes

The average student to faculty ratio over the last 6 years is 28.60 to 1 where the current academic year ratio is 28 to 1. The following table and chart illustrate the change of student to faculty ratio at Capital Area Technical College since 2017.
TableChart
YearStudent to Faculty Ratio
2012-1330:1
2013-1430:1
2014-1528:1
2015-1627:1
2016-1728:1
Average28.60:1
Student to Faculty Ratio Changes of Capital Area Technical College
Related Articles and Ads