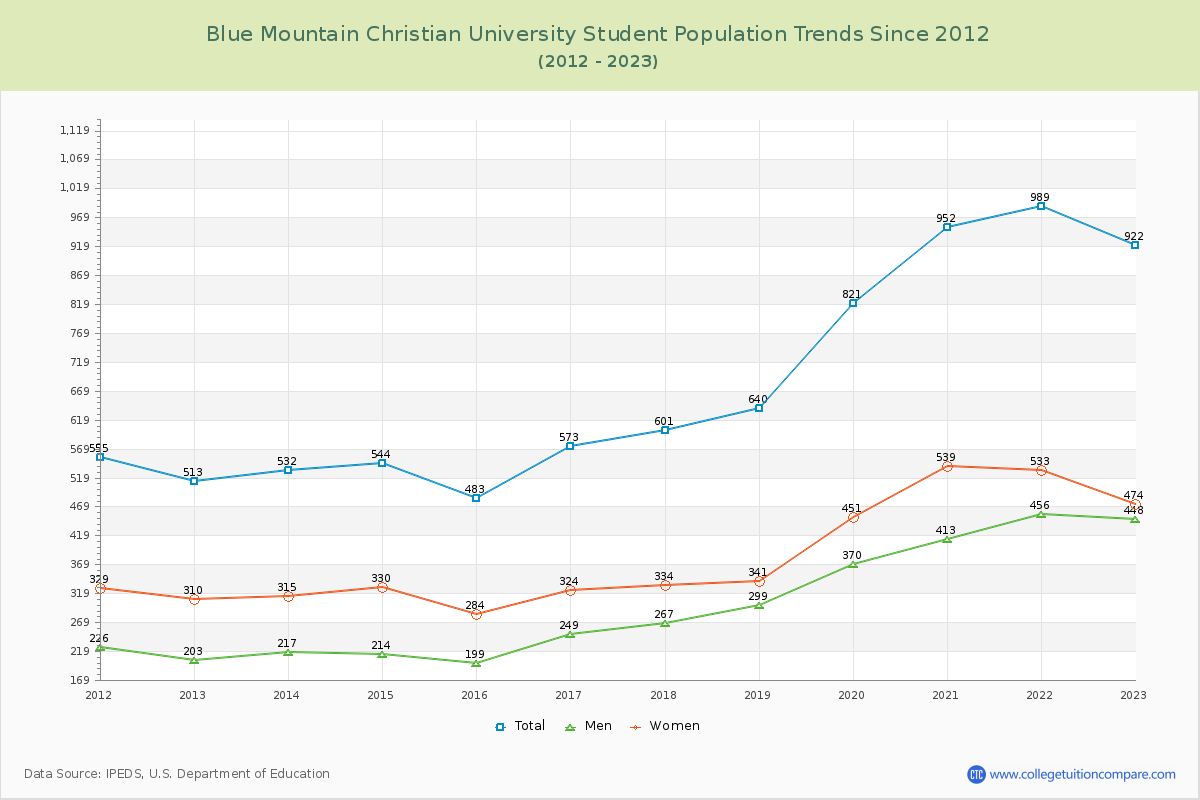
Student Population Changes
The average student population over the last 12 years is 688 where 922 students are attending the school for the academic year 2022-2023.
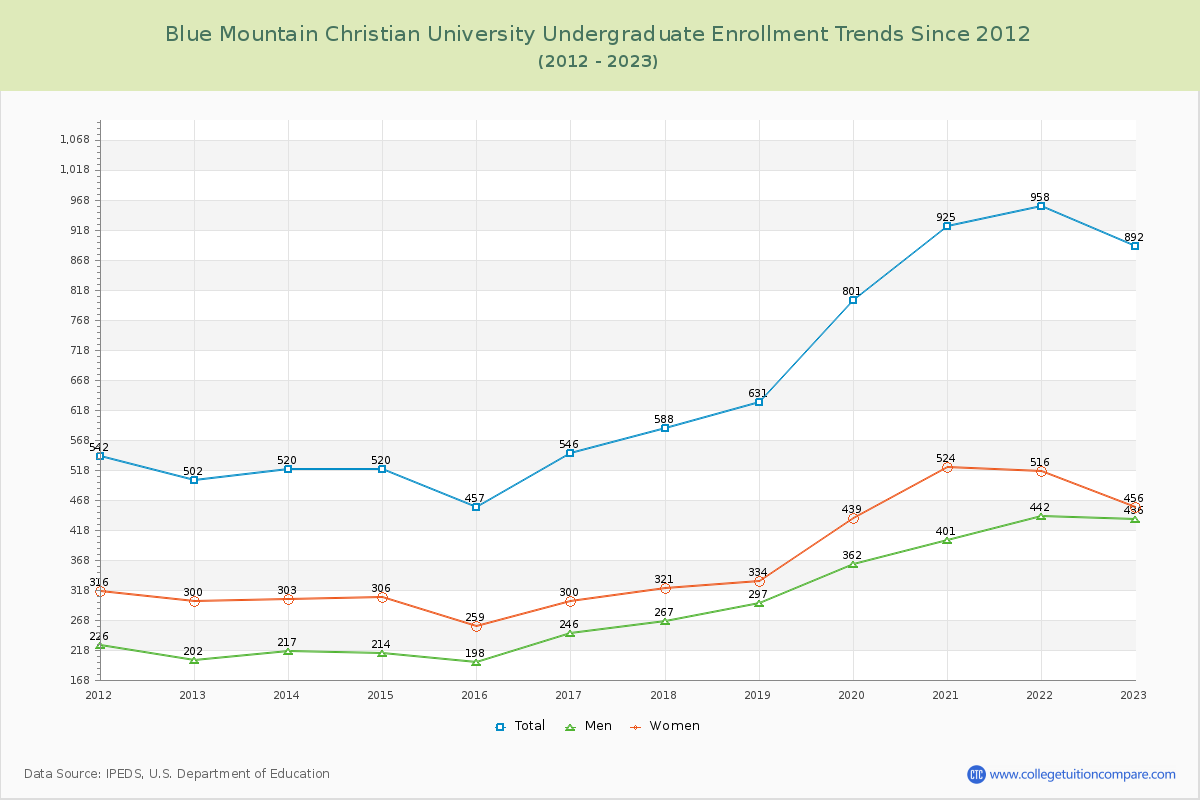
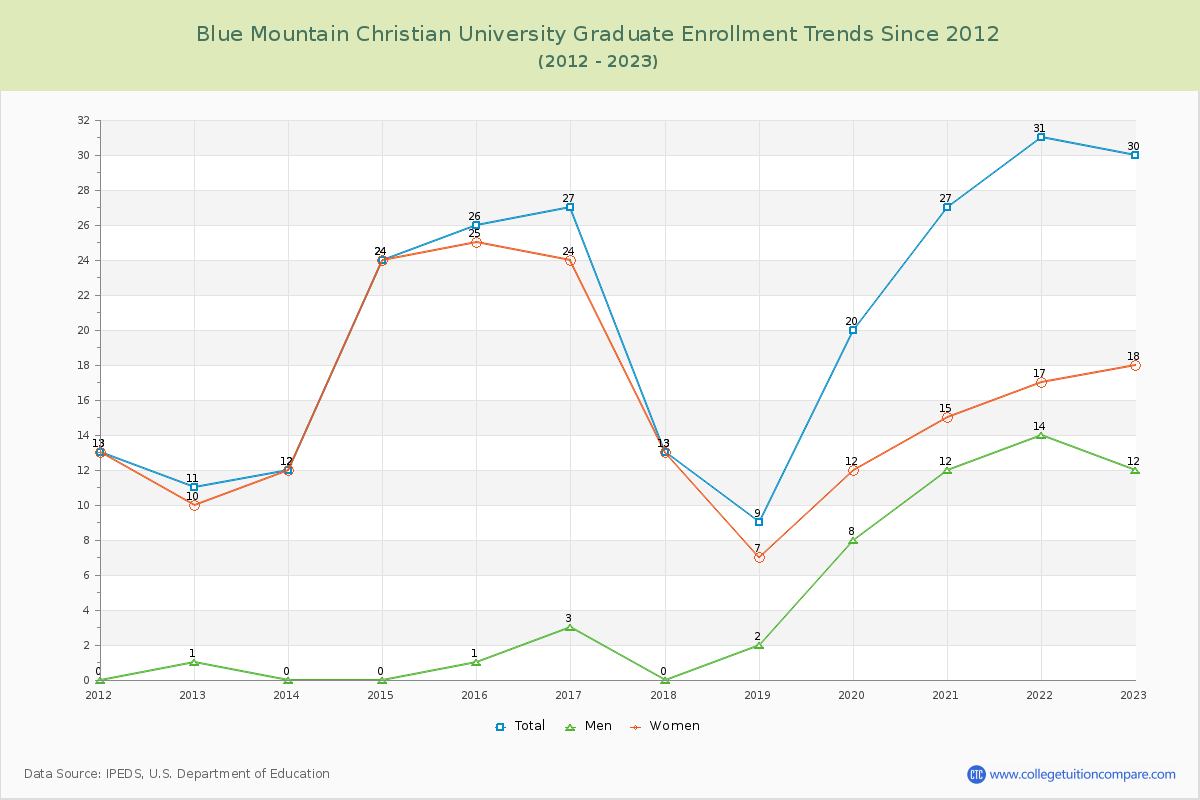
96.75% of total students is undergraduate students and 3.25% students is graduate students. The number of undergraduate students has increased by 390 and the graduate enrollment has increased by 19 over past 10 years.
The female to male ratio is 1.06 to 1 and it means that there are similar numbers of female and male students enrolled in Blue Mountain Christian.
The following table and chart illustrate the changes in student population by gender at Blue Mountain Christian University since 2012.
| Year | Total | Undergraduate | Graduate | ||||
|---|---|---|---|---|---|---|---|
| Total | Men | Women | Total | Men | Women | ||
| 2012-13 | 513 | 502 | 202 | 300 | 11 | 1 | 10 |
| 2013-14 | 532 19 | 520 18 | 217 15 | 303 3 | 12 1 | 0 -1 | 12 2 |
| 2014-15 | 544 12 | 520 0 | 214 -3 | 306 3 | 24 12 | 0 0 | 24 12 |
| 2015-16 | 483 -61 | 457 -63 | 198 -16 | 259 -47 | 26 2 | 1 1 | 25 1 |
| 2016-17 | 573 90 | 546 89 | 246 48 | 300 41 | 27 1 | 3 2 | 24 -1 |
| 2017-18 | 601 28 | 588 42 | 267 21 | 321 21 | 13 -14 | 0 -3 | 13 -11 |
| 2018-19 | 640 39 | 631 43 | 297 30 | 334 13 | 9 -4 | 2 2 | 7 -6 |
| 2019-20 | 821 181 | 801 170 | 362 65 | 439 105 | 20 11 | 8 6 | 12 5 |
| 2020-21 | 952 131 | 925 124 | 401 39 | 524 85 | 27 7 | 12 4 | 15 3 |
| 2021-22 | 989 37 | 958 33 | 442 41 | 516 -8 | 31 4 | 14 2 | 17 2 |
| 2022-23 | 922 -67 | 892 -66 | 436 -6 | 456 -60 | 30 -1 | 12 -2 | 18 1 |
| Average | 688 | 667 | 298 | 369 | 21 | 5 | 16 |