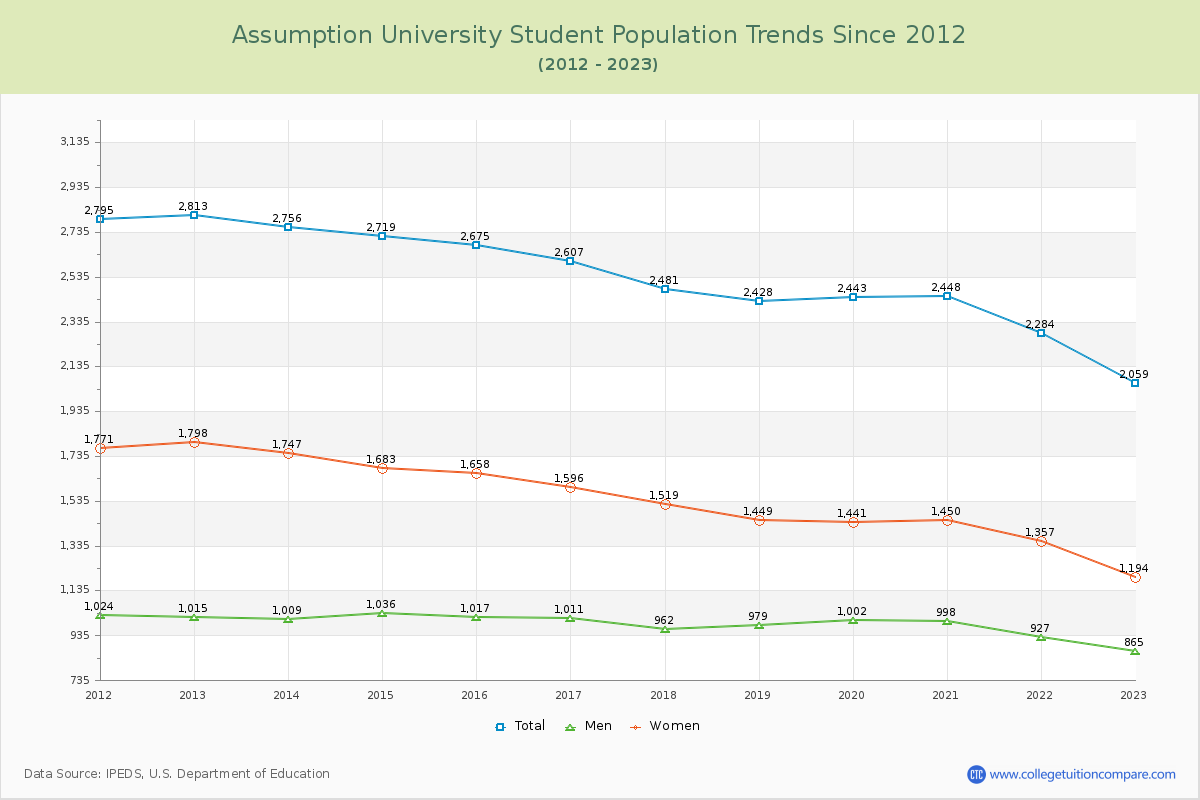
Student Population Changes
The average student population over the last 12 years is 2,519 where 2,059 students are attending the school for the academic year 2022-2023.
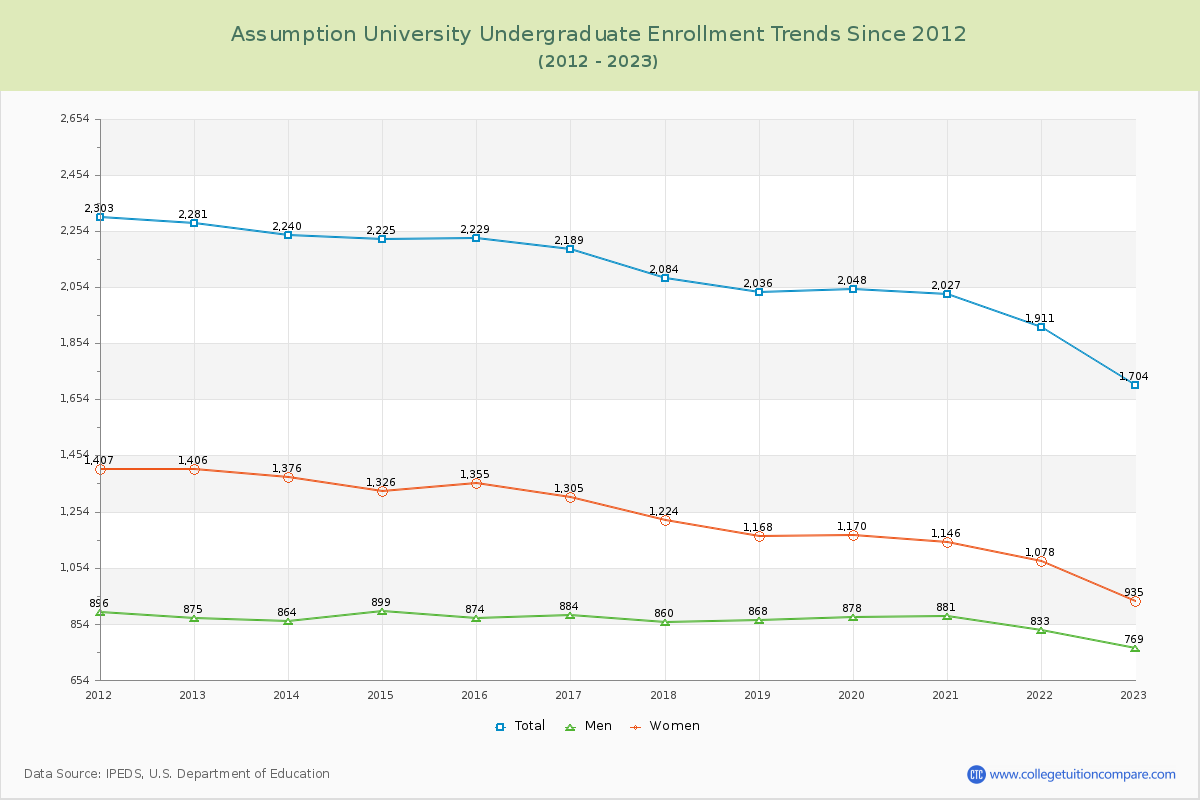
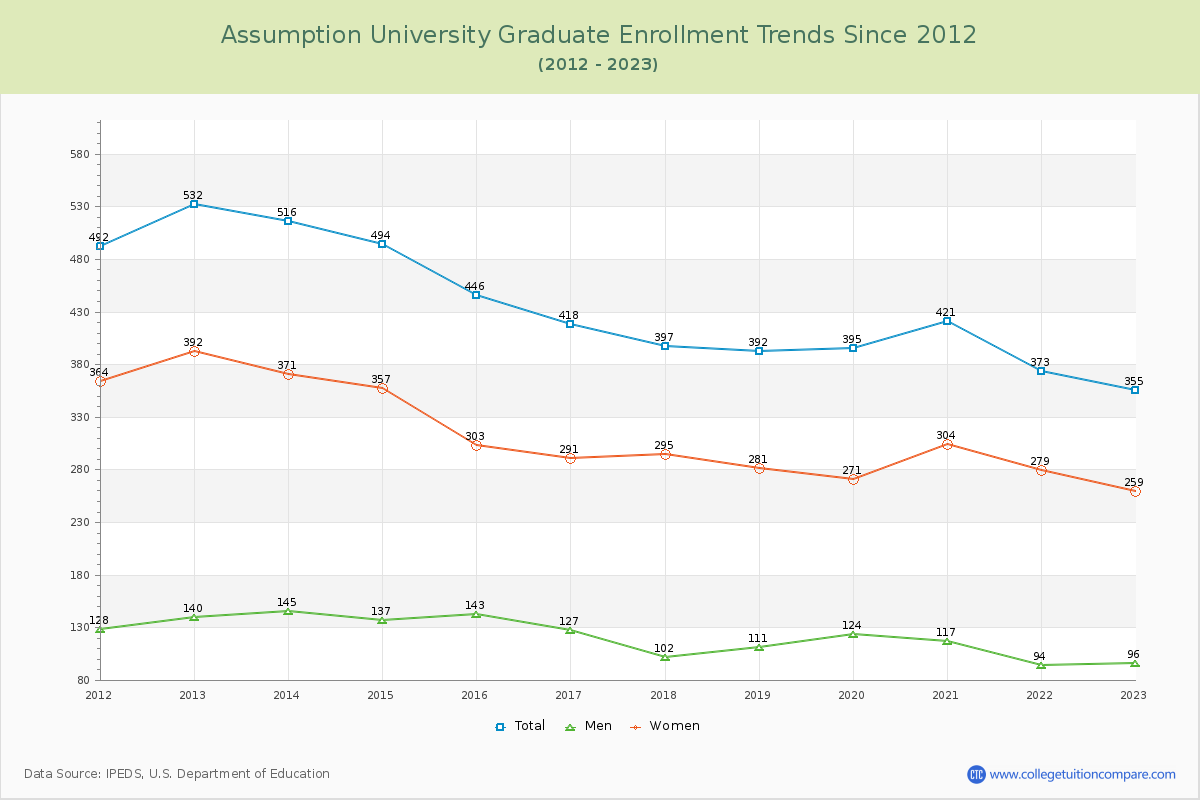
82.76% of total students is undergraduate students and 17.24% students is graduate students. The number of undergraduate students has decreased by 577 and the graduate enrollment has decreased by 177 over past 10 years.
The female to male ratio is 1.38 to 1 and it means that there are more female students enrolled in Assumption than male students.
The following table and chart illustrate the changes in student population by gender at Assumption University since 2012.
| Year | Total | Undergraduate | Graduate | ||||
|---|---|---|---|---|---|---|---|
| Total | Men | Women | Total | Men | Women | ||
| 2012-13 | 2,813 | 2,281 | 875 | 1,406 | 532 | 140 | 392 |
| 2013-14 | 2,756 -57 | 2,240 -41 | 864 -11 | 1,376 -30 | 516 -16 | 145 5 | 371 -21 |
| 2014-15 | 2,719 -37 | 2,225 -15 | 899 35 | 1,326 -50 | 494 -22 | 137 -8 | 357 -14 |
| 2015-16 | 2,675 -44 | 2,229 4 | 874 -25 | 1,355 29 | 446 -48 | 143 6 | 303 -54 |
| 2016-17 | 2,607 -68 | 2,189 -40 | 884 10 | 1,305 -50 | 418 -28 | 127 -16 | 291 -12 |
| 2017-18 | 2,481 -126 | 2,084 -105 | 860 -24 | 1,224 -81 | 397 -21 | 102 -25 | 295 4 |
| 2018-19 | 2,428 -53 | 2,036 -48 | 868 8 | 1,168 -56 | 392 -5 | 111 9 | 281 -14 |
| 2019-20 | 2,443 15 | 2,048 12 | 878 10 | 1,170 2 | 395 3 | 124 13 | 271 -10 |
| 2020-21 | 2,448 5 | 2,027 -21 | 881 3 | 1,146 -24 | 421 26 | 117 -7 | 304 33 |
| 2021-22 | 2,284 -164 | 1,911 -116 | 833 -48 | 1,078 -68 | 373 -48 | 94 -23 | 279 -25 |
| 2022-23 | 2,059 -225 | 1,704 -207 | 769 -64 | 935 -143 | 355 -18 | 96 2 | 259 -20 |
| Average | 2,519 | 2,089 | 862 | 1,226 | 431 | 121 | 309 |