Student Population by Gender
Husson University has a total of 3,065 enrolled students for the academic year 2022-2023. 2,429 students have enrolled in undergraduate programs and 636 students joined graduate programs.
By gender, 1,184 male and 1,881 female students (the male-female ratio is 39:61) are attending the school. The gender distribution is based on the 2022-2023 data.
| Total | Undergraduate | Graduate | |
|---|---|---|---|
| Total | 3,065 | 2,429 | 636 |
| Men | 1,184 | 1,000 | 184 |
| Women | 1,881 | 1,429 | 452 |
Student Distribution by Race/Ethnicity
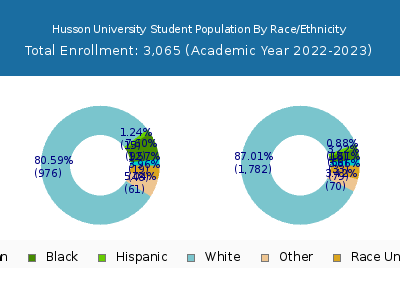
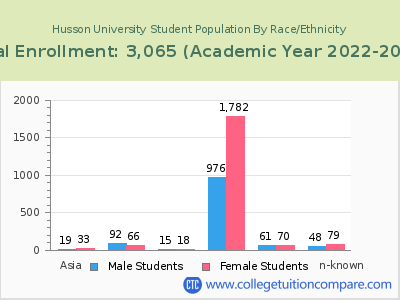
| Race | Total | Men | Women |
|---|---|---|---|
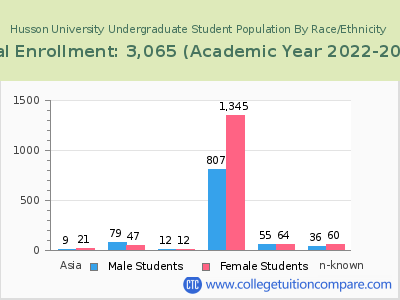
| American Indian or Native American | 14 | 8 | 6 |
| Asian | 42 | 12 | 30 |
| Black | 175 | 101 | 74 |
| Hispanic | 31 | 14 | 17 |
| Native Hawaiian or Other Pacific Islanders | 1 | 1 | 0 |
| White | 2,545 | 932 | 1,613 |
| Two or more races | 112 | 54 | 58 |
| Race Unknown | 115 | 40 | 75 |
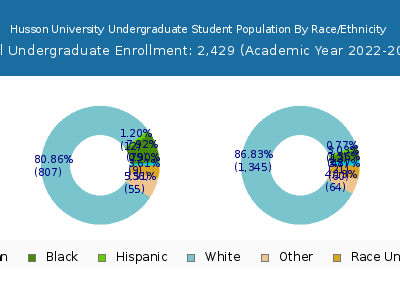
| Race | Total | Men | Women |
|---|---|---|---|
| American Indian or Native American | 13 | 8 | 5 |
| Asian | 27 | 7 | 20 |
| Black | 149 | 94 | 55 |
| Hispanic | 23 | 10 | 13 |
| Native Hawaiian or Other Pacific Islanders | 0 | 0 | 0 |
| White | 2,029 | 790 | 1,239 |
| Two or more races | 104 | 49 | 55 |
| Race Unknown | 64 | 25 | 39 |
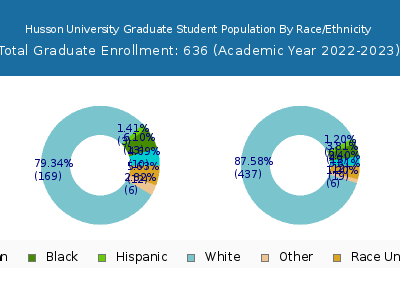
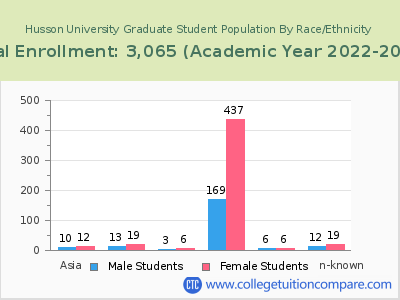
| Race | Total | Men | Women |
|---|---|---|---|
| American Indian or Native American | 1 | 1 | 0 |
| Asian | 0 | 0 | 0 |
| Black | 8 | 4 | 4 |
| Hispanic | 0 | 0 | 0 |
| Native Hawaiian or Other Pacific Islanders | 0 | 0 | 0 |
| White | 70 | 29 | 41 |
| Two or more races | 2 | 1 | 1 |
| Race Unknown | 6 | 1 | 5 |
Student Age Distribution
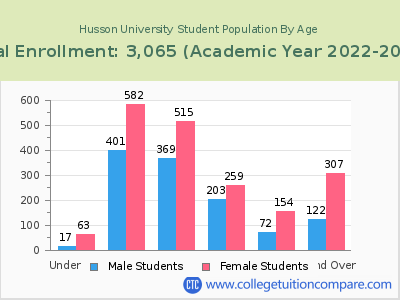
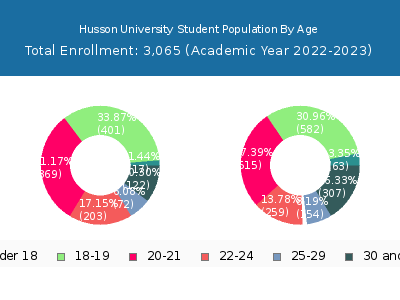
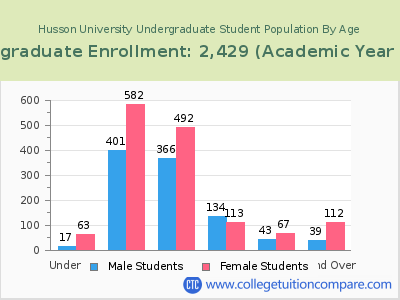
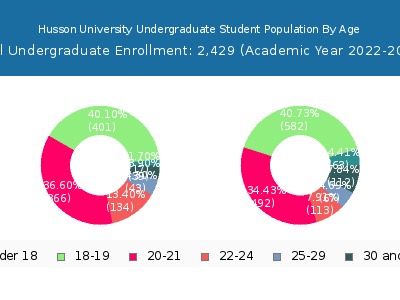
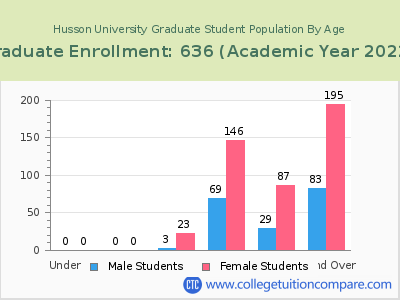
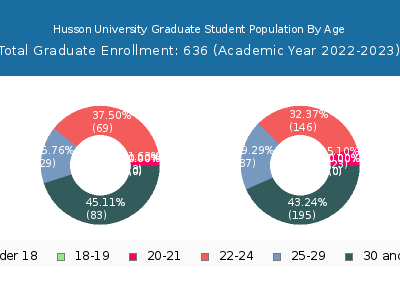
By age, Husson has 80 students under 18 years old and 2 students over 65 years old. There are 2,409 students under 25 years old, and 655 students over 25 years old out of 3,065 total students.
In undergraduate programs, 80 students are younger than 18 and 2 students are older than 65. Husson has 2,168 undergraduate students aged under 25 and 261 students aged 25 and over.
It has 241 graduate students aged under 25 and 394 students aged 25 and over.
| Age | Total | Men | Women |
|---|---|---|---|
| Under 18 | 80 | 63 | 17 |
| 18-19 | 983 | 582 | 401 |
| 20-21 | 884 | 515 | 369 |
| 22-24 | 462 | 259 | 203 |
| 25-29 | 226 | 154 | 72 |
| 30-34 | 141 | 95 | 46 |
| 35-39 | 95 | 65 | 30 |
| 40-49 | 130 | 101 | 29 |
| 50-64 | 61 | 45 | 16 |
| Over 65 | 2 | 1 | 1 |
| Age | Total | Men | Women |
|---|---|---|---|
| Under 18 | 80 | 63 | 17 |
| 18-19 | 983 | 582 | 401 |
| 20-21 | 858 | 492 | 366 |
| 22-24 | 247 | 113 | 134 |
| 25-29 | 110 | 67 | 43 |
| 30-34 | 55 | 37 | 18 |
| 35-39 | 26 | 21 | 5 |
| 40-49 | 44 | 35 | 9 |
| 50-64 | 24 | 18 | 6 |
| Over 65 | 2 | 1 | 1 |
| Age | Total | Men | Women |
|---|
Online Student Enrollment
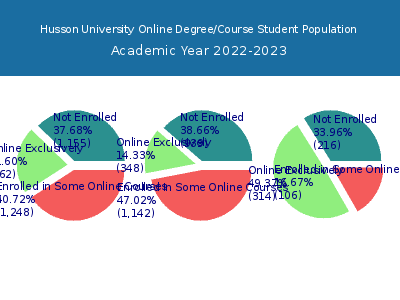
Distance learning, also called online education, is very attractive to students, especially who want to continue education and work in field. At Husson University, 662 students are enrolled exclusively in online courses and 1,248 students are enrolled in some online courses.
537 students lived in Maine or jurisdiction in which the school is located are enrolled exclusively in online courses and 125 students live in other State or outside of the United States.
| All Students | Enrolled Exclusively Online Courses | Enrolled in Some Online Courses | |
|---|---|---|---|
| All Students | 3,065 | 662 | 1,248 |
| Undergraduate | 2,429 | 348 | 1,142 |
| Graduate | 636 | 314 | 106 |
| Maine Residents | Other States in U.S. | Outside of U.S. | |
|---|---|---|---|
| All Students | 537 | 124 | 1 |
| Undergraduate | 294 | 54 | 0 |
| Graduate | 243 | 70 | 1 |
Transfer-in Students (Undergraduate)
Among 2,429 enrolled in undergraduate programs, 87 students have transferred-in from other institutions. The percentage of transfer-in students is 3.58%.60 students have transferred in as full-time status and 27 students transferred in as part-time status.
| Number of Students | |
|---|---|
| Regular Full-time | 1,978 |
| Transfer-in Full-time | 60 |
| Regular Part-time | 364 |
| Transfer-in Part-time | 27 |
