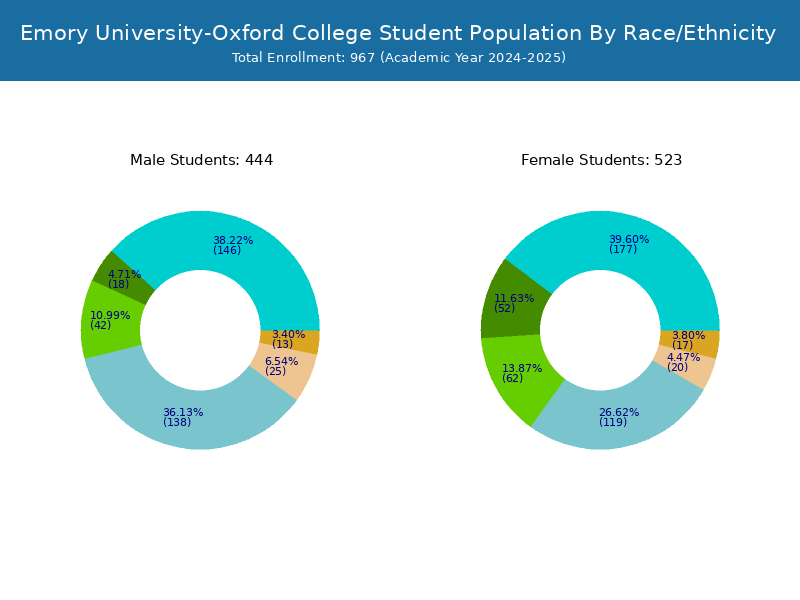
Student Population by Gender
Emory University-Oxford College has a total of 1,048 enrolled students for the academic year 2022-2023. All 1,048 students are enrolled into undergraduate programs.
By gender, 494 male and 554 female students (the male-female ratio is 47:53) are attending the school. The gender distribution is based on the 2022-2023 data.
| Undergraduate | |
|---|---|
| Total | 1,048 |
| Men | 494 |
| Women | 554 |
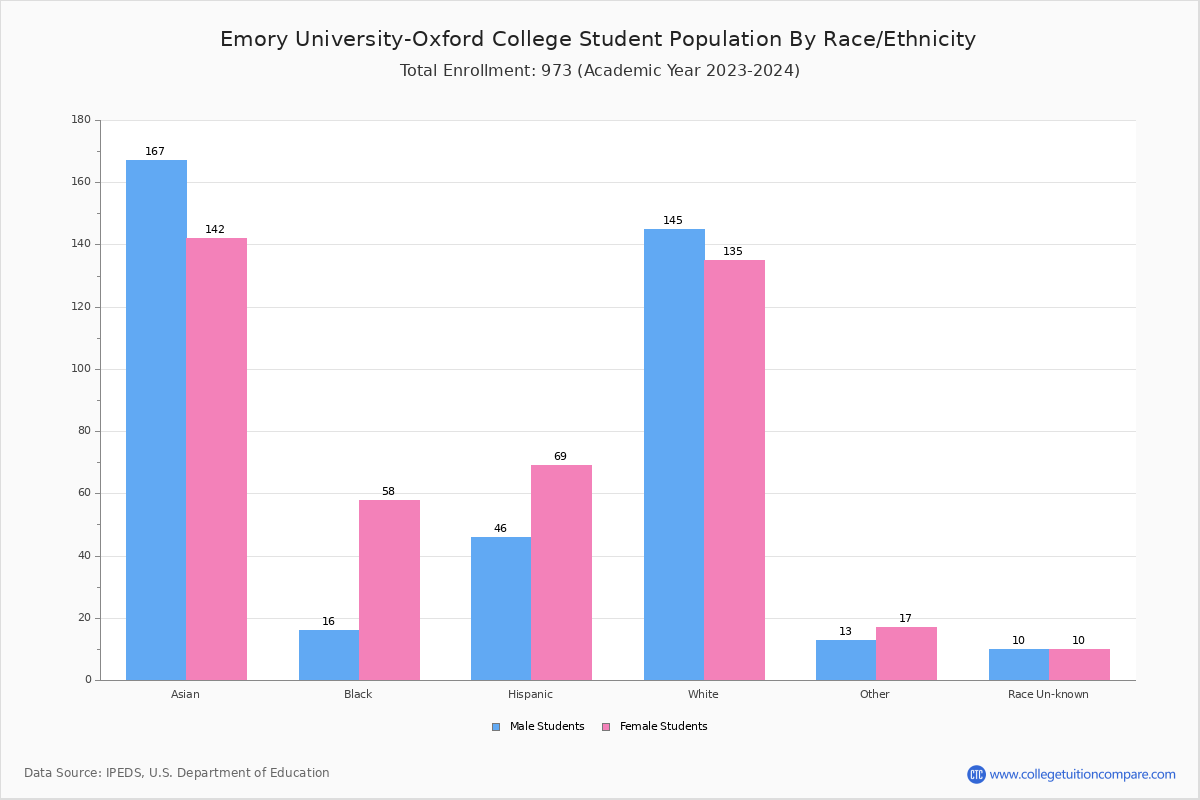
Student Distribution by Race/Ethnicity
By race/ethnicity, 332 White, 93 Black, and 320 Asian students out of a total of 1,048 are attending at Emory University-Oxford College. Comprehensive enrollment statistic data by race/ethnicity is shown in the next chart (Academic year 2022-2023 data).
| Race | Total | Men | Women |
|---|---|---|---|
| American Indian or Native American | 0 | 0 | 0 |
| Asian | 320 | 168 | 152 |
| Black | 93 | 22 | 71 |
| Hispanic | 112 | 48 | 64 |
| Native Hawaiian or Other Pacific Islanders | 1 | 1 | 0 |
| White | 332 | 164 | 168 |
| Two or more races | 30 | 10 | 20 |
| Race Unknown | 20 | 8 | 12 |
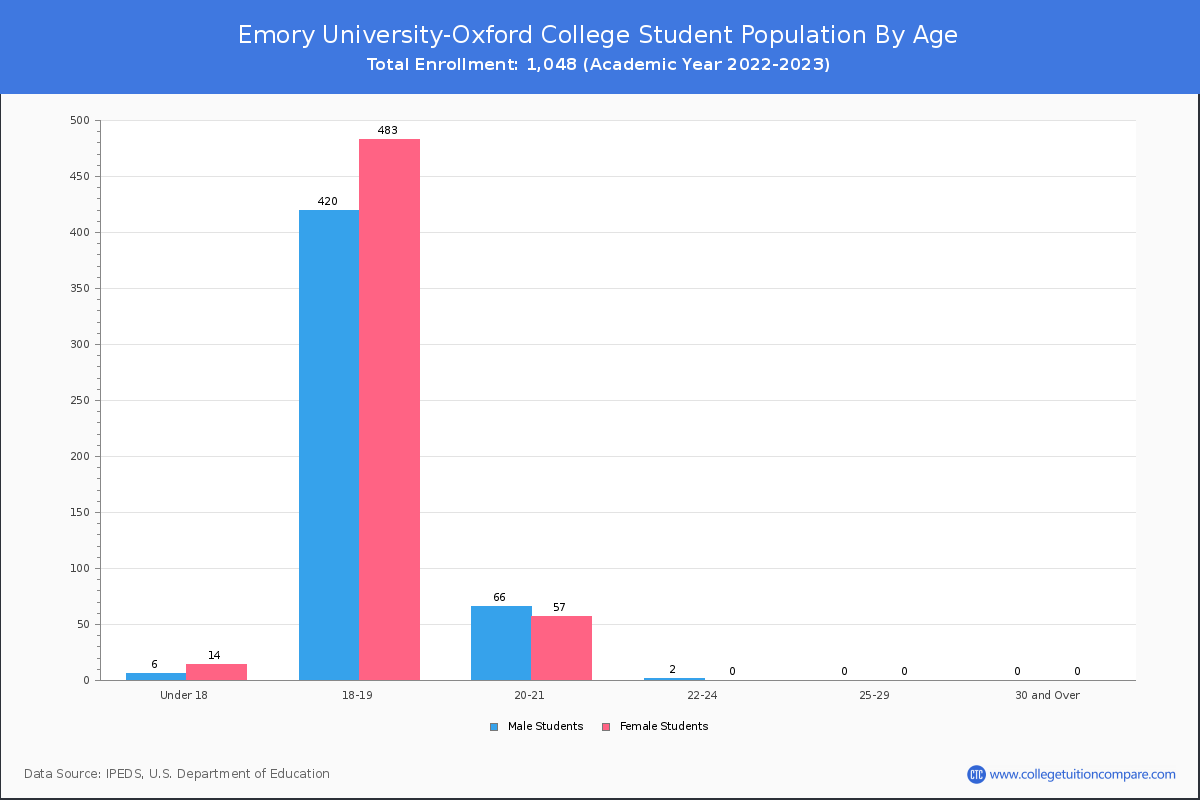
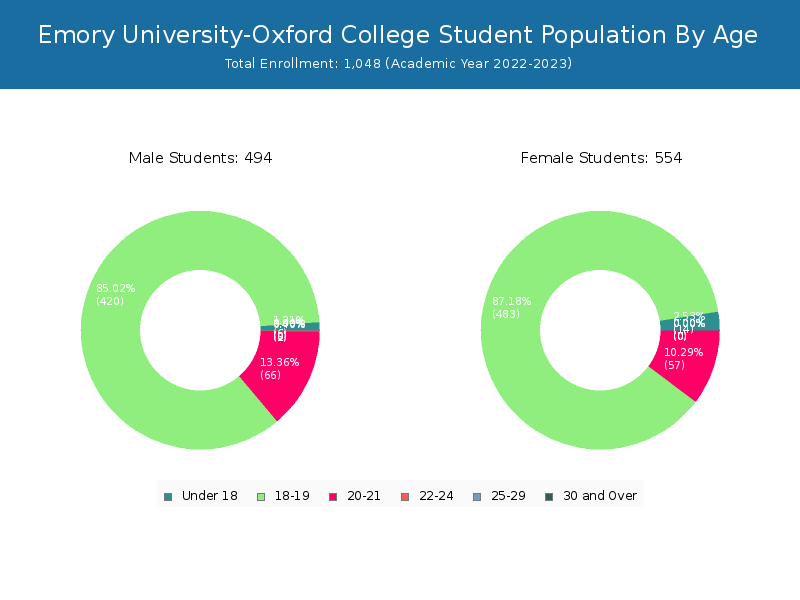
Student Age Distribution
By age, all students enrolled at Emory University-Oxford are under 25 years of age.
| Age | Total | Men | Women |
|---|---|---|---|
| Under 18 | 20 | 14 | 6 |
| 18-19 | 903 | 483 | 420 |
| 20-21 | 123 | 57 | 66 |
| 22-24 | 2 | 0 | 2 |
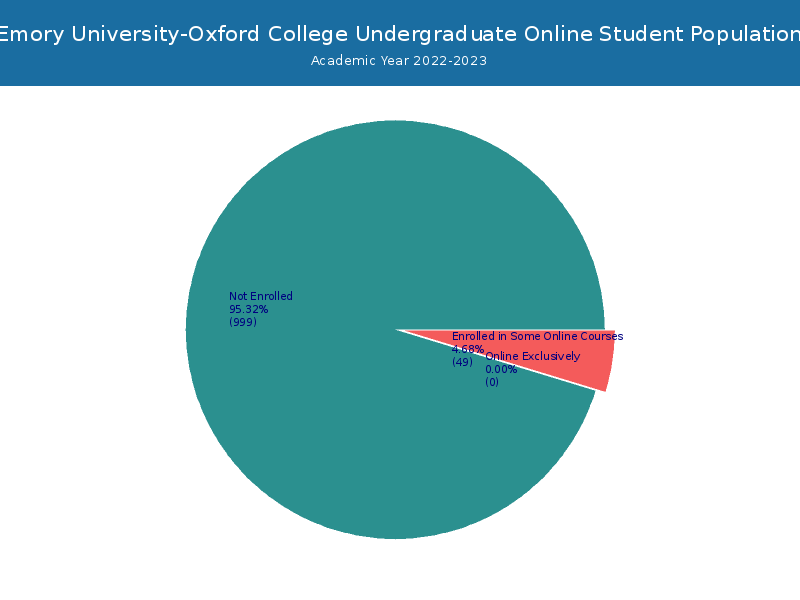
Online Student Enrollment
Distance learning, also called online education, is very attractive to students, especially who want to continue education and work in field. At Emory University-Oxford College, 49 students are enrolled in some online courses.
| All Students | Enrolled Exclusively Online Courses | Enrolled in Some Online Courses | |
|---|---|---|---|
| All Students | 1,048 | 0 | 49 |
| Undergraduate | 1,048 | 0 | 49 |
| Georgia Residents | Other States in U.S. | Outside of U.S. | |
|---|---|---|---|
| All Students | 0 | - | 0 |
| Undergraduate | 0 | - | 0 |
| Graduate | - | - | - |