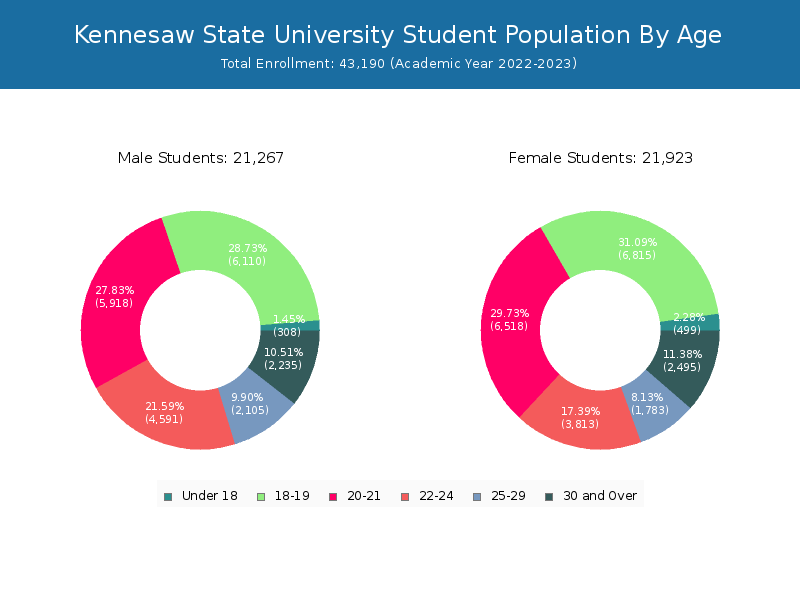
Student Population by Gender
Kennesaw State University has a total of 43,190 enrolled students for the academic year 2022-2023. 38,927 students have enrolled in undergraduate programs and 4,263 students joined graduate programs.
By gender, 21,267 male and 21,923 female students (the male-female ratio is 49:51) are attending the school. The gender distribution is based on the 2022-2023 data.
| Total | Undergraduate | Graduate | |
|---|---|---|---|
| Total | 43,190 | 38,927 | 4,263 |
| Men | 21,267 | 19,423 | 1,844 |
| Women | 21,923 | 19,504 | 2,419 |
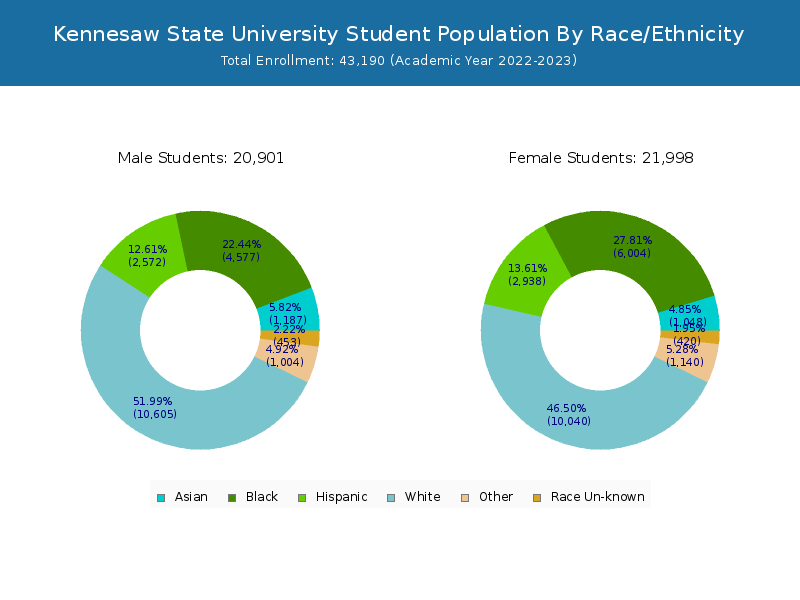
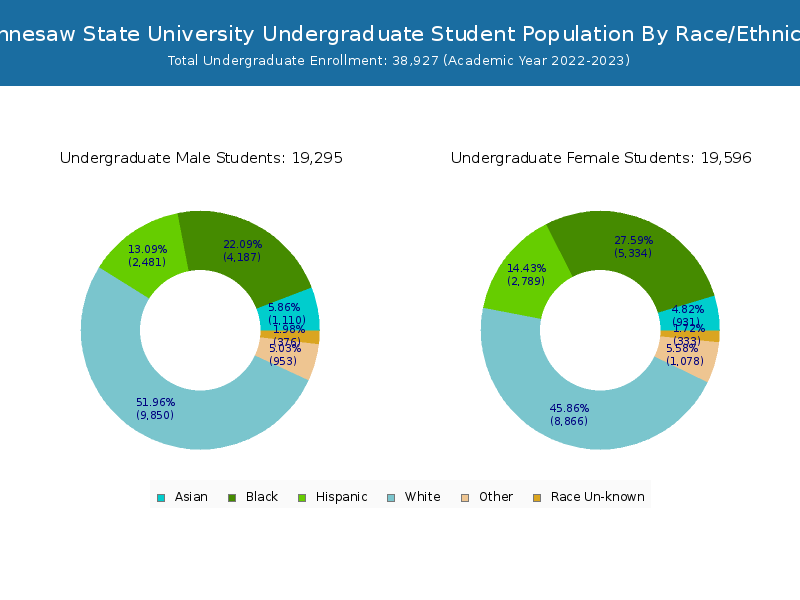
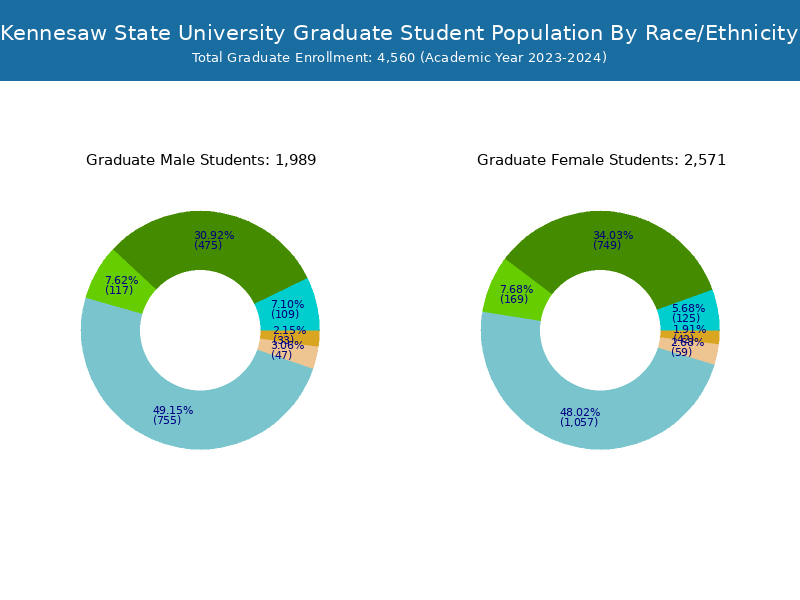
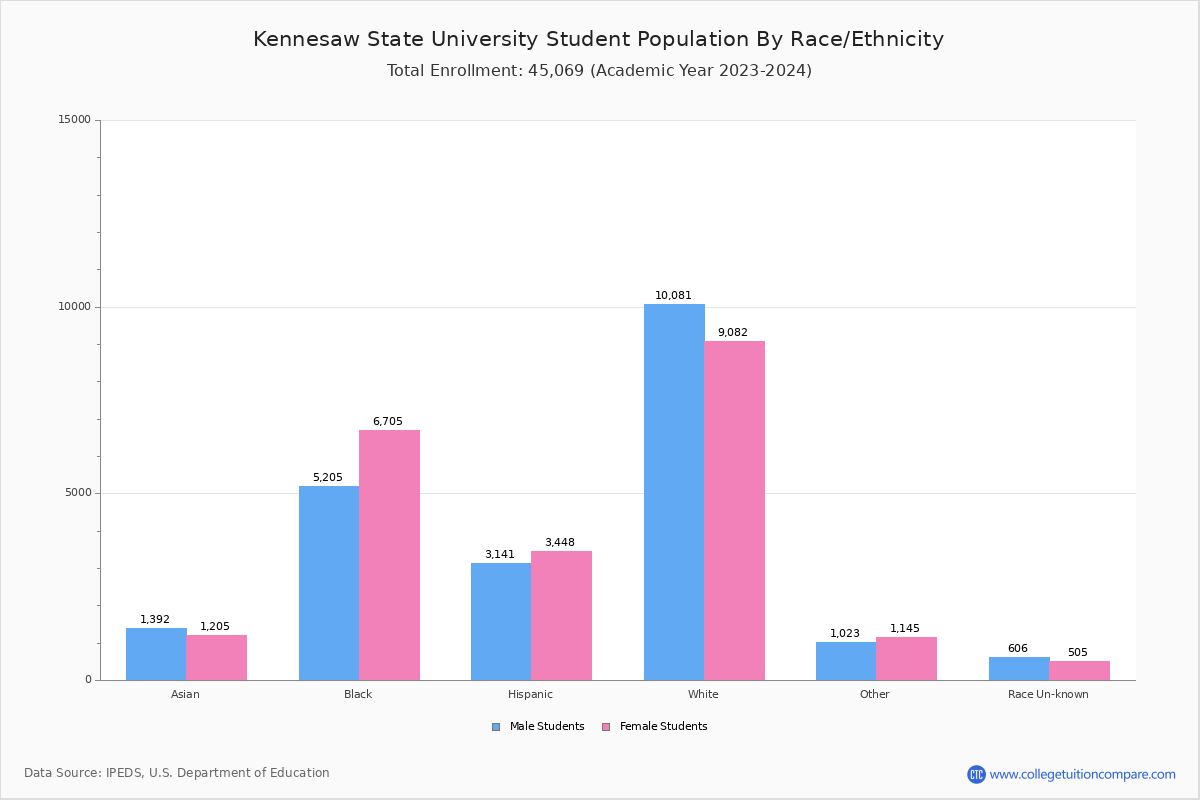
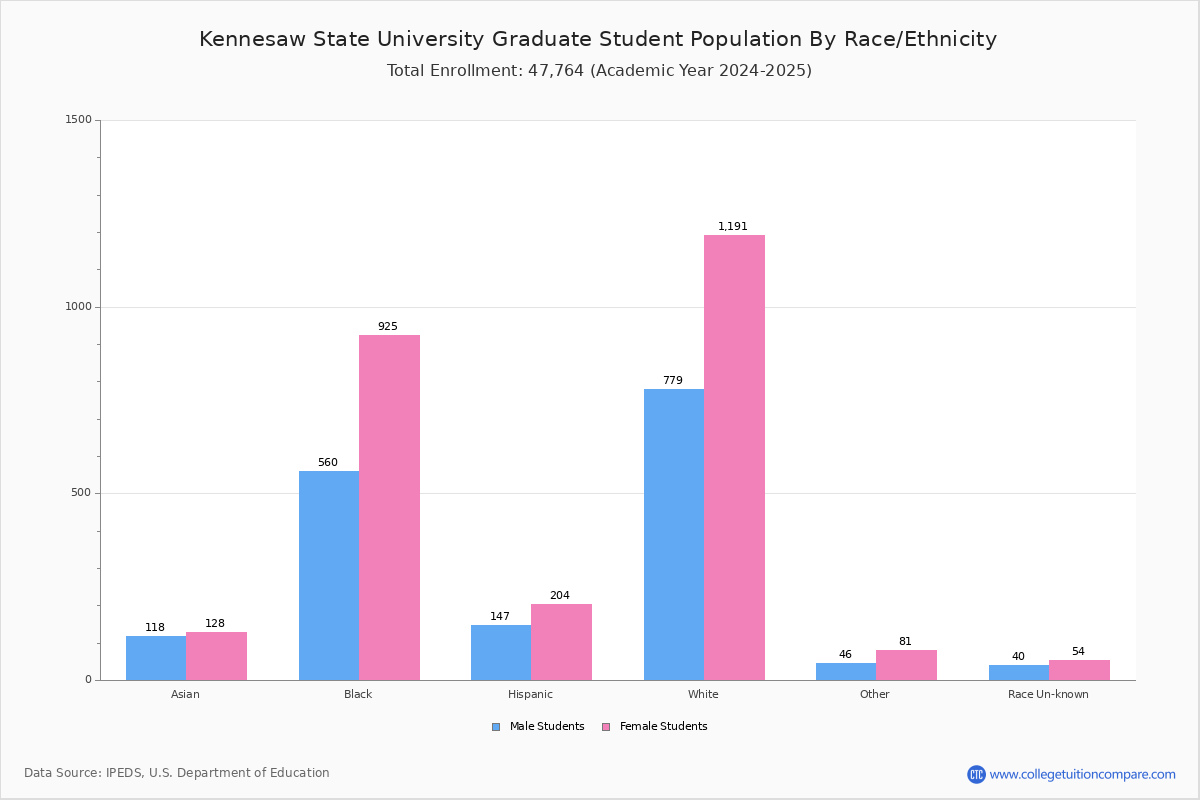
Student Distribution by Race/Ethnicity
By race/ethnicity, 19,655 White, 10,805 Black, and 2,368 Asian students out of a total of 43,190 are attending at Kennesaw State University. Comprehensive enrollment statistic data by race/ethnicity is shown in the next chart (Academic year 2022-2023 data).

| Race | Total | Men | Women |
|---|---|---|---|
| American Indian or Native American | 62 | 35 | 27 |
| Asian | 2,368 | 1,272 | 1,096 |
| Black | 10,805 | 4,686 | 6,119 |
| Hispanic | 5,886 | 2,779 | 3,107 |
| Native Hawaiian or Other Pacific Islanders | 56 | 32 | 24 |
| White | 19,655 | 10,291 | 9,364 |
| Two or more races | 2,049 | 928 | 1,121 |
| Race Unknown | 1,042 | 553 | 489 |
| Race | Total | Men | Women |
|---|---|---|---|
| American Indian or Native American | 56 | 33 | 23 |
| Asian | 2,148 | 1,165 | 983 |
| Black | 9,717 | 4,279 | 5,438 |
| Hispanic | 5,618 | 2,684 | 2,934 |
| Native Hawaiian or Other Pacific Islanders | 50 | 26 | 24 |
| White | 17,815 | 9,524 | 8,291 |
| Two or more races | 1,951 | 882 | 1,069 |
| Race Unknown | 928 | 497 | 431 |
| Race | Total | Men | Women |
|---|---|---|---|
| American Indian or Native American | 4 | 2 | 2 |
| Asian | 120 | 68 | 52 |
| Black | 755 | 347 | 408 |
| Hispanic | 425 | 217 | 208 |
| Native Hawaiian or Other Pacific Islanders | 5 | 3 | 2 |
| White | 1,258 | 657 | 601 |
| Two or more races | 139 | 58 | 81 |
| Race Unknown | 114 | 54 | 60 |
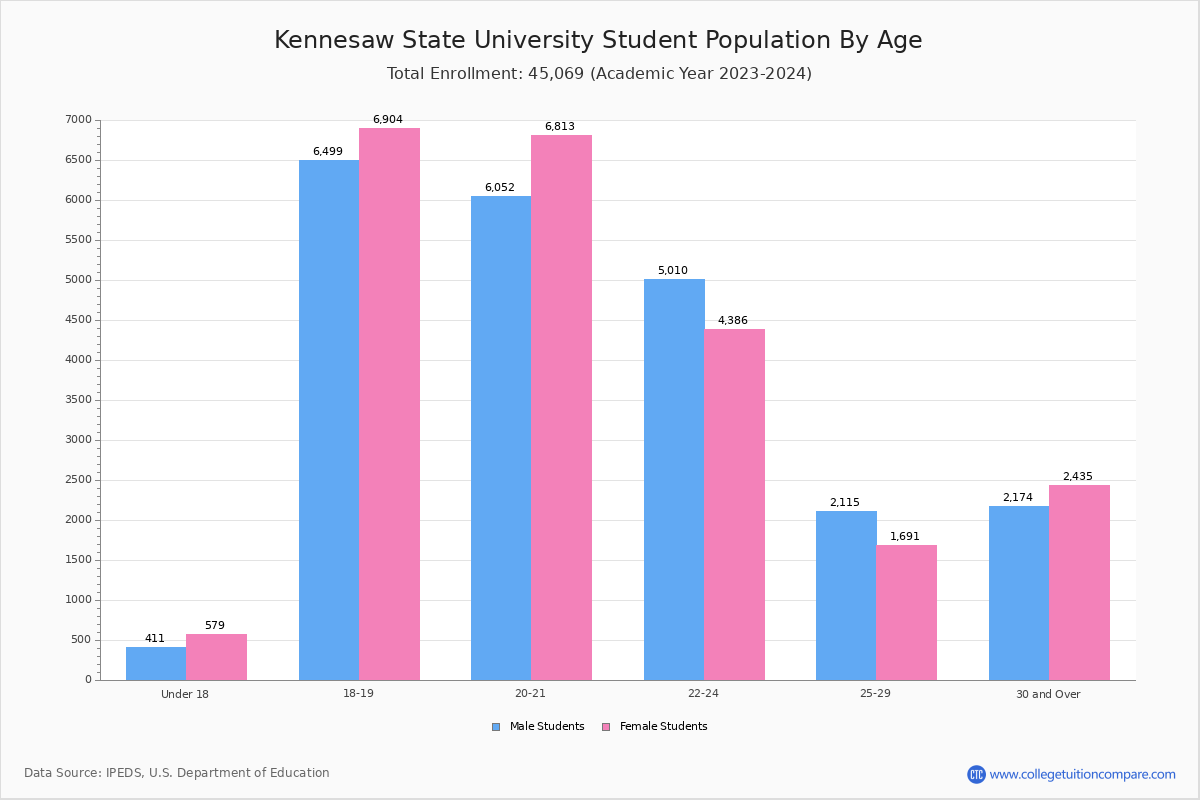
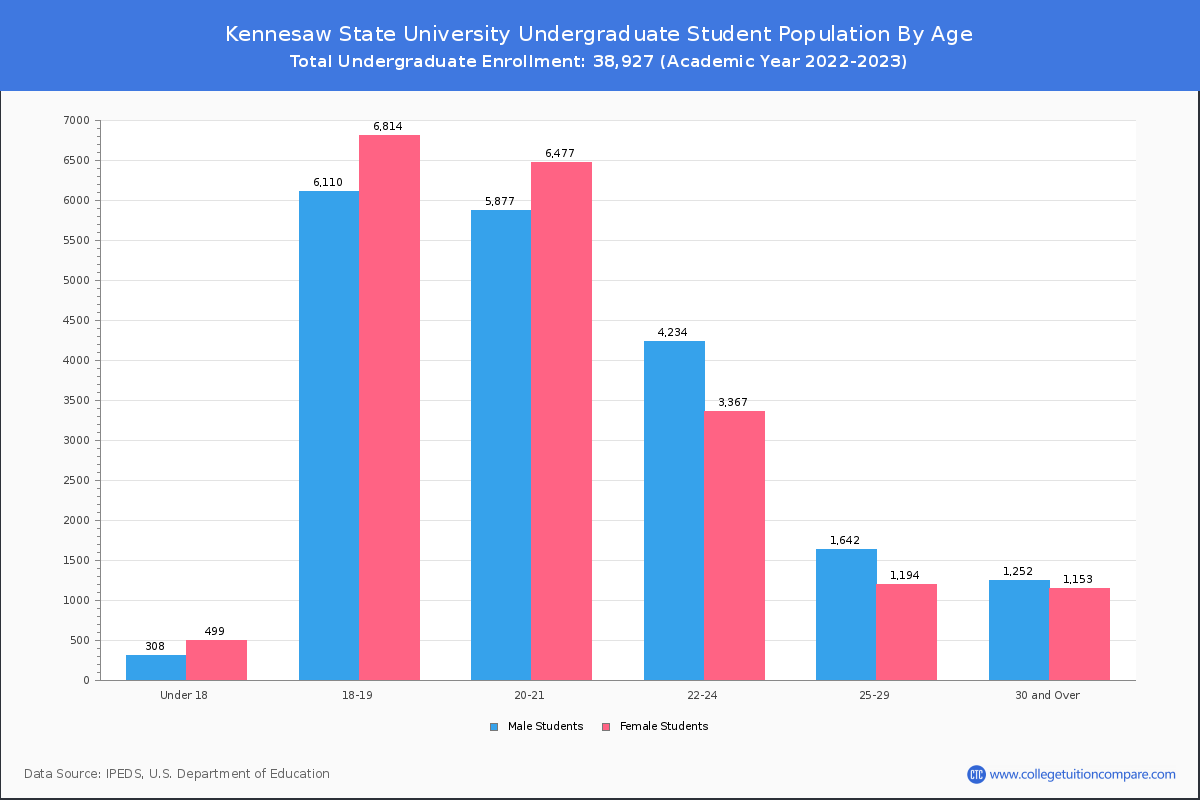
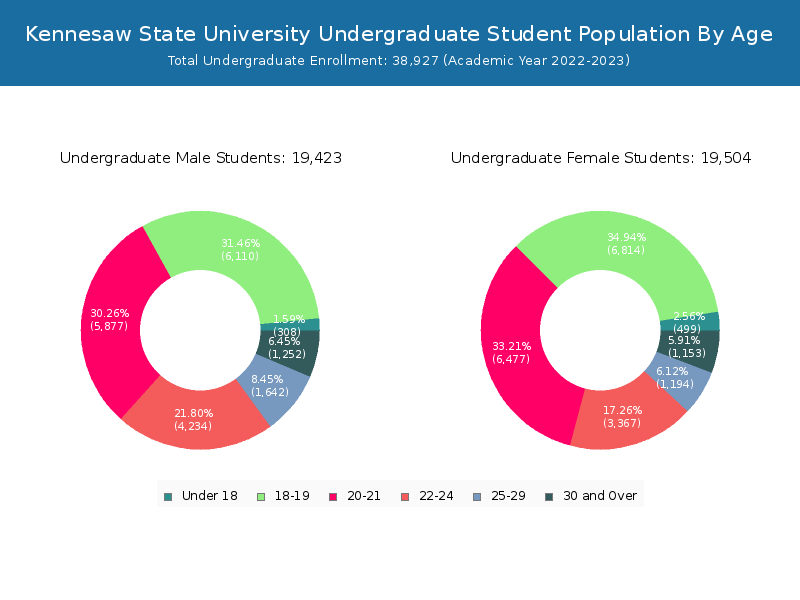
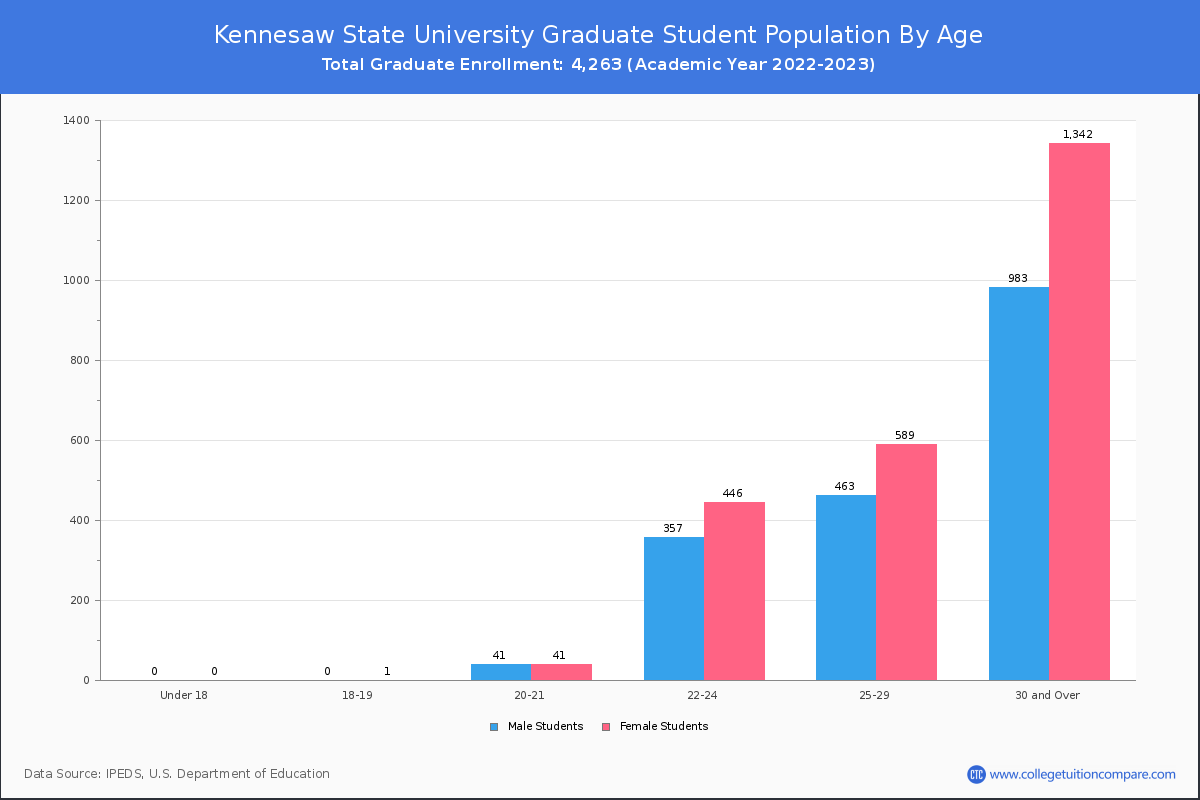
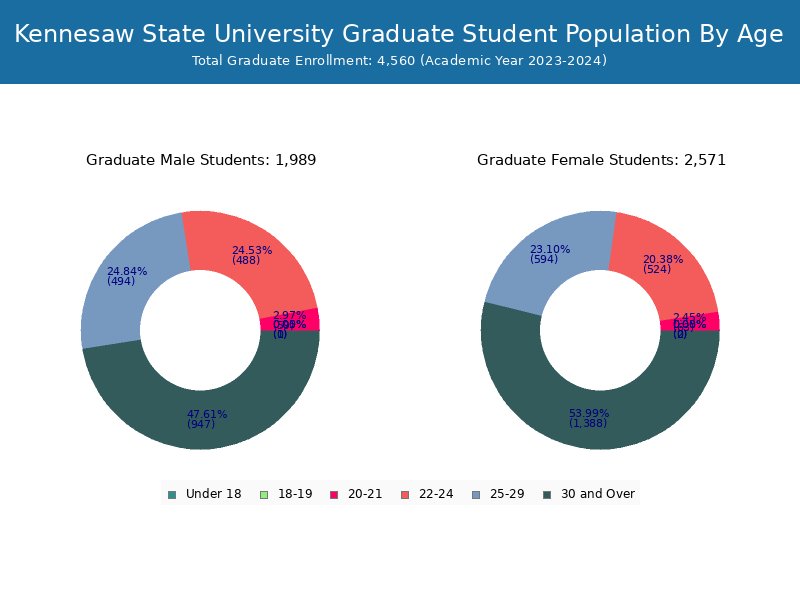
Student Age Distribution
By age, KSU has 807 students under 18 years old and 96 students over 65 years old. There are 34,572 students under 25 years old, and 8,618 students over 25 years old out of 43,190 total students.
In undergraduate programs, 807 students are younger than 18 and 72 students are older than 65. KSU has 33,686 undergraduate students aged under 25 and 5,241 students aged 25 and over.
It has 886 graduate students aged under 25 and 3,377 students aged 25 and over.
| Age | Total | Men | Women |
|---|---|---|---|
| Under 18 | 807 | 499 | 308 |
| 18-19 | 12,925 | 6,815 | 6,110 |
| 20-21 | 12,436 | 6,518 | 5,918 |
| 22-24 | 8,404 | 3,813 | 4,591 |
| 25-29 | 3,888 | 1,783 | 2,105 |
| 30-34 | 1,785 | 880 | 905 |
| 35-39 | 1,097 | 567 | 530 |
| 40-49 | 1,241 | 689 | 552 |
| 50-64 | 511 | 311 | 200 |
| Over 65 | 96 | 48 | 48 |
| Age | Total | Men | Women |
|---|---|---|---|
| Under 18 | 807 | 499 | 308 |
| 18-19 | 12,924 | 6,814 | 6,110 |
| 20-21 | 12,354 | 6,477 | 5,877 |
| 22-24 | 7,601 | 3,367 | 4,234 |
| 25-29 | 2,836 | 1,194 | 1,642 |
| 30-34 | 1,100 | 497 | 603 |
| 35-39 | 549 | 255 | 294 |
| 40-49 | 519 | 263 | 256 |
| 50-64 | 165 | 101 | 64 |
| Over 65 | 72 | 37 | 35 |
| Age | Total | Men | Women |
|---|
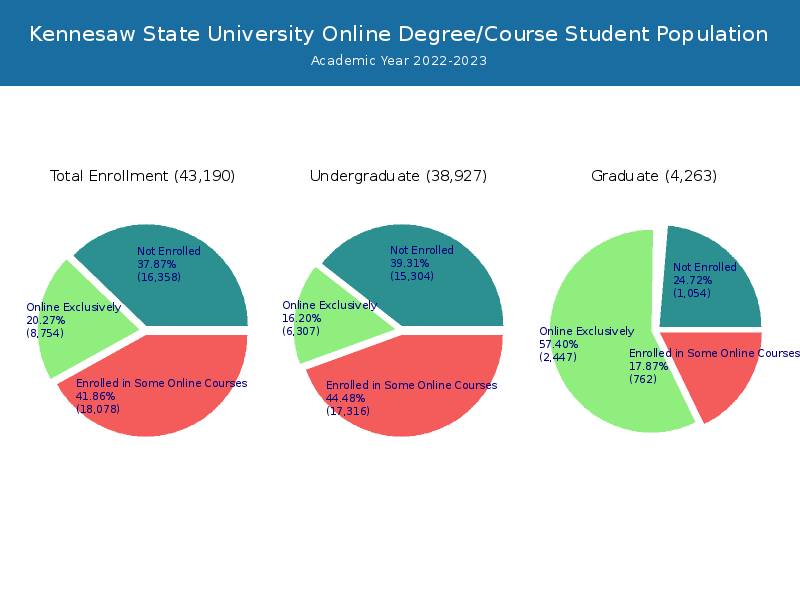
Online Student Enrollment
Distance learning, also called online education, is very attractive to students, especially who want to continue education and work in field. At Kennesaw State University, 8,754 students are enrolled exclusively in online courses and 18,078 students are enrolled in some online courses.
8,021 students lived in Georgia or jurisdiction in which the school is located are enrolled exclusively in online courses and 733 students live in other State or outside of the United States.
| All Students | Enrolled Exclusively Online Courses | Enrolled in Some Online Courses | |
|---|---|---|---|
| All Students | 43,190 | 8,754 | 18,078 |
| Undergraduate | 38,927 | 6,307 | 17,316 |
| Graduate | 4,263 | 2,447 | 762 |
| Georgia Residents | Other States in U.S. | Outside of U.S. | |
|---|---|---|---|
| All Students | 8,021 | 534 | 199 |
| Undergraduate | 5,863 | 326 | 118 |
| Graduate | 2,158 | 208 | 81 |
Transfer-in Students (Undergraduate)
Among 38,927 enrolled in undergraduate programs, 2,886 students have transferred-in from other institutions. The percentage of transfer-in students is 7.41%.2,090 students have transferred in as full-time status and 796 students transferred in as part-time status.
| Number of Students | |
|---|---|
| Regular Full-time | 26,681 |
| Transfer-in Full-time | 2,090 |
| Regular Part-time | 9,360 |
| Transfer-in Part-time | 796 |