Student Population by Gender
University of Phoenix-Nevada has a total of 30 enrolled students for the academic year 2022-2023. All 30 students are enrolled into undergraduate programs.
By gender, 22 male and 8 female students (the male-female ratio is 73:27) are attending the school. The gender distribution is based on the 2022-2023 data.
| Total | Undergraduate | Graduate | |
|---|---|---|---|
| Total | 30 | 30 | - |
| Men | 22 | 22 | - |
| Women | 8 | 8 | - |
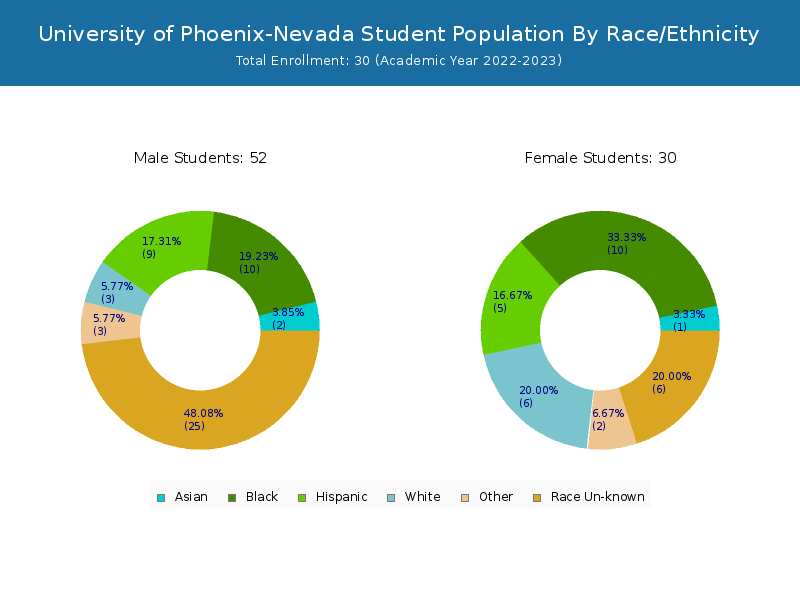
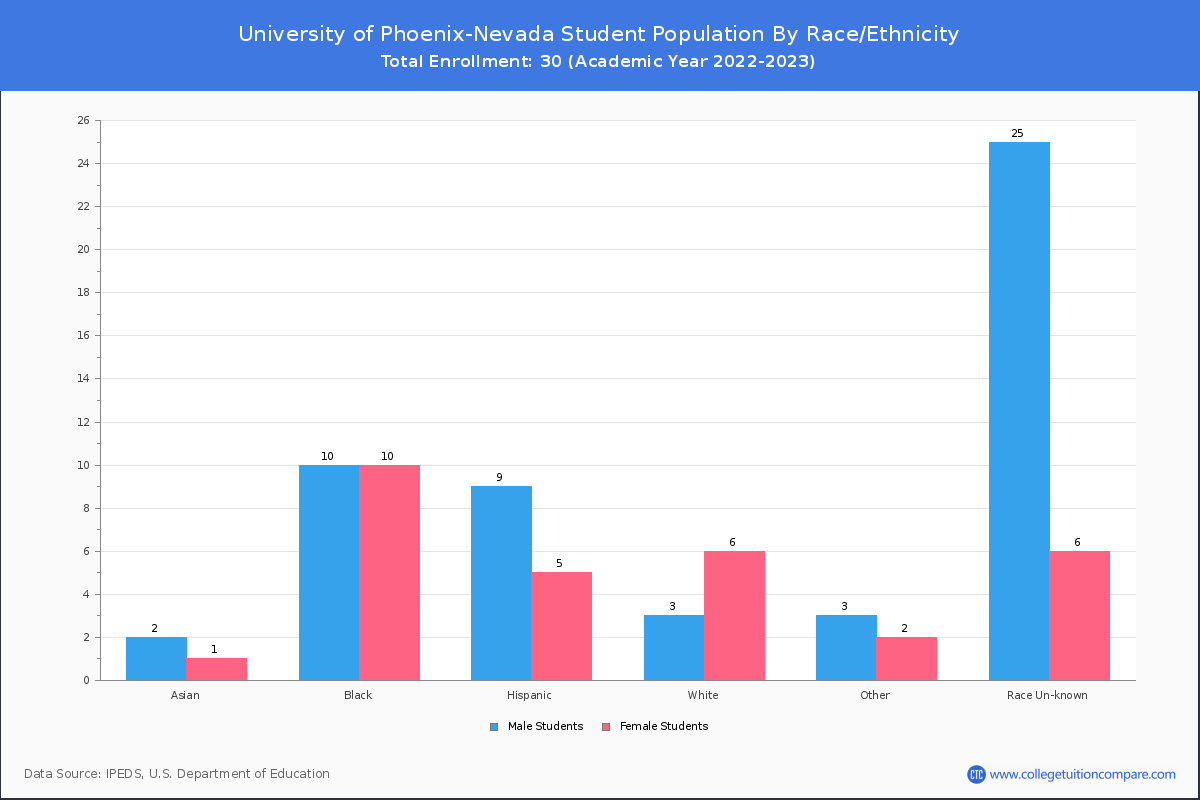
Student Distribution by Race/Ethnicity
By race/ethnicity, 4 White, 9 Black, and 1 Asian students out of a total of 30 are attending at University of Phoenix-Nevada. Comprehensive enrollment statistic data by race/ethnicity is shown in the next chart (Academic year 2022-2023 data).
| Race | Total | Men | Women |
|---|---|---|---|
| American Indian or Native American | 0 | 0 | 0 |
| Asian | 1 | 1 | 0 |
| Black | 9 | 5 | 4 |
| Hispanic | 3 | 2 | 1 |
| Native Hawaiian or Other Pacific Islanders | 1 | 1 | 0 |
| White | 4 | 3 | 1 |
| Two or more races | 1 | 0 | 1 |
| Race Unknown | 11 | 10 | 1 |
Student Age Distribution
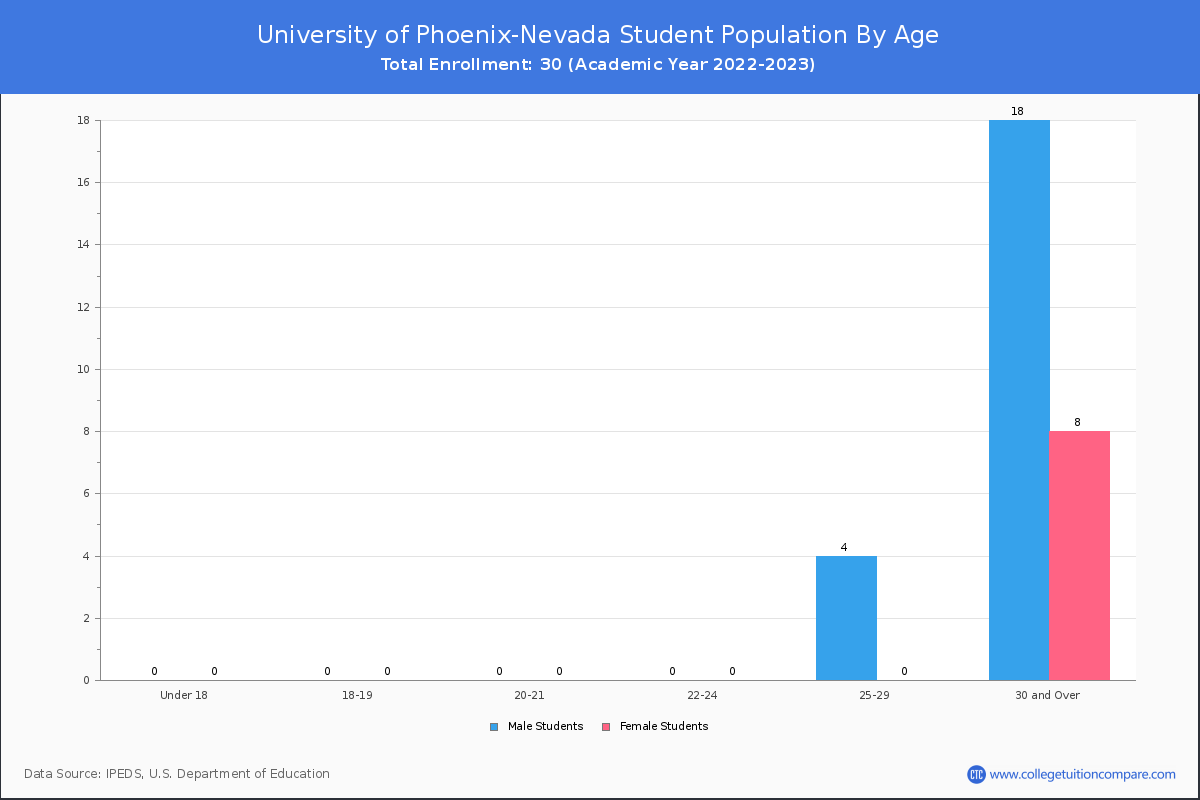
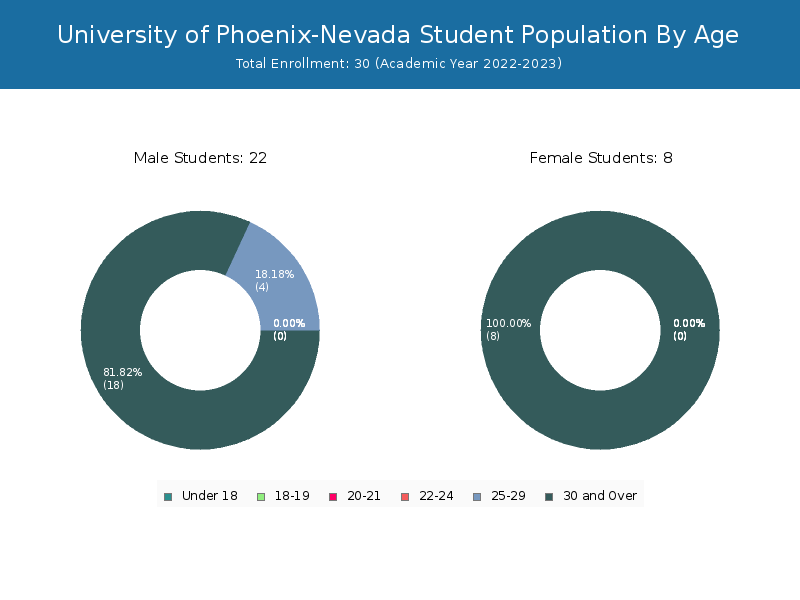
| Age | Total | Men | Women |
|---|
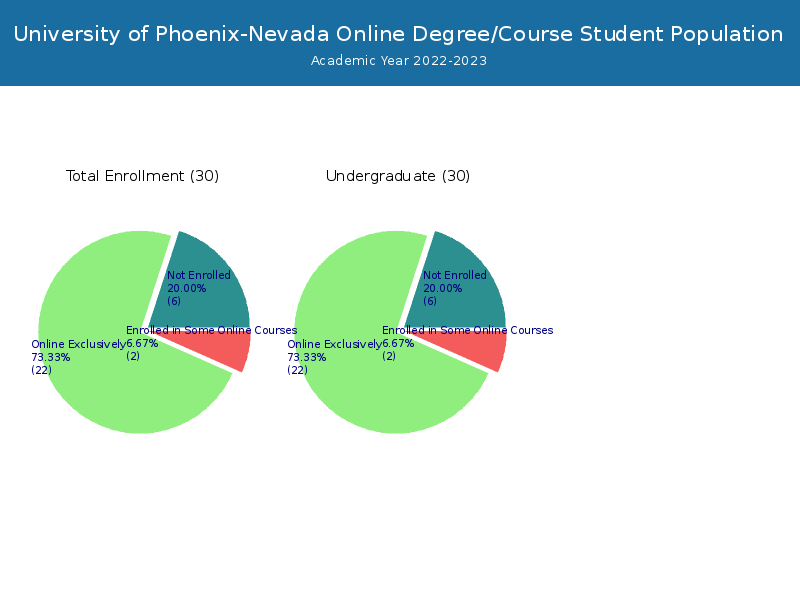
Online Student Enrollment
Distance learning, also called online education, is very attractive to students, especially who want to continue education and work in field. At University of Phoenix-Nevada, 22 students are enrolled exclusively in online courses and 2 students are enrolled in some online courses.
16 students lived in Nevada or jurisdiction in which the school is located are enrolled exclusively in online courses and 6 students live in other State or outside of the United States.
| All Students | Enrolled Exclusively Online Courses | Enrolled in Some Online Courses | |
|---|---|---|---|
| All Students | 30 | 22 | 2 |
| Undergraduate | 30 | 22 | 2 |
| Nevada Residents | Other States in U.S. | Outside of U.S. | |
|---|---|---|---|
| All Students | 16 | 6 | 0 |
| Undergraduate | 16 | 6 | 0 |
| Graduate | - | - | - |