Student Population by Gender
West Coast University-Orange County has a total of 4,475 enrolled students for the academic year 2022-2023. 3,023 students have enrolled in undergraduate programs and 1,452 students joined graduate programs.
By gender, 949 male and 3,526 female students (the male-female ratio is 21:79) are attending the school. The gender distribution is based on the 2022-2023 data.
| Total | Undergraduate | Graduate | |
|---|---|---|---|
| Total | 4,475 | 3,023 | 1,452 |
| Men | 949 | 680 | 269 |
| Women | 3,526 | 2,343 | 1,183 |
Student Distribution by Race/Ethnicity
| Race | Total | Men | Women |
|---|---|---|---|
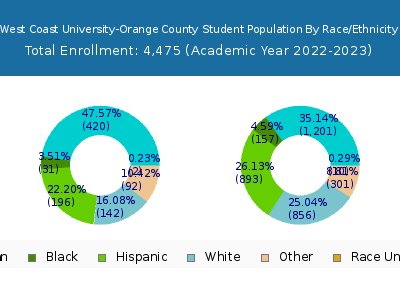
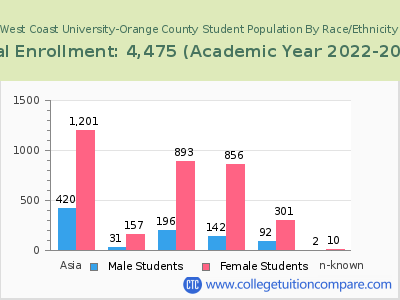
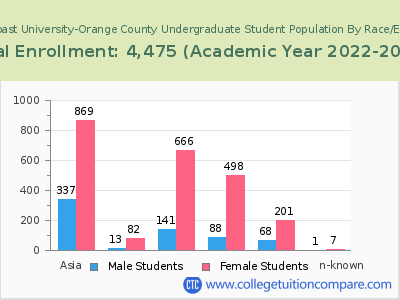
| American Indian or Native American | 14 | 5 | 9 |
| Asian | 1,648 | 433 | 1,215 |
| Black | 164 | 23 | 141 |
| Hispanic | 1,324 | 237 | 1,087 |
| Native Hawaiian or Other Pacific Islanders | 72 | 24 | 48 |
| White | 910 | 146 | 764 |
| Two or more races | 318 | 76 | 242 |
| Race Unknown | 10 | 5 | 5 |
| Race | Total | Men | Women |
|---|---|---|---|
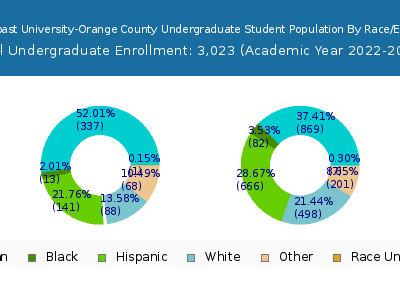
| American Indian or Native American | 11 | 4 | 7 |
| Asian | 1,210 | 339 | 871 |
| Black | 76 | 13 | 63 |
| Hispanic | 969 | 170 | 799 |
| Native Hawaiian or Other Pacific Islanders | 41 | 13 | 28 |
| White | 487 | 91 | 396 |
| Two or more races | 213 | 49 | 164 |
| Race Unknown | 1 | 1 | 0 |
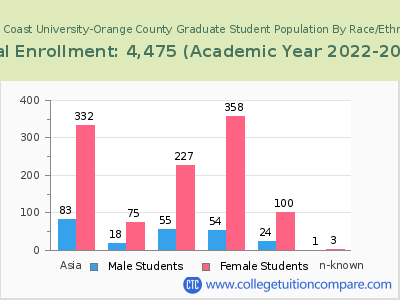
| Race | Total | Men | Women |
|---|---|---|---|
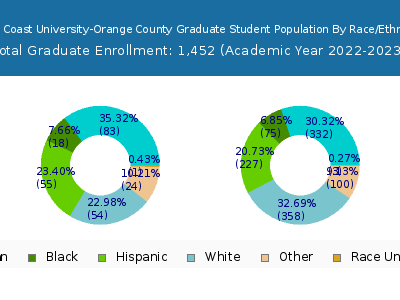
| American Indian or Native American | 2 | 0 | 2 |
| Asian | 131 | 42 | 89 |
| Black | 11 | 1 | 10 |
| Hispanic | 98 | 18 | 80 |
| Native Hawaiian or Other Pacific Islanders | 3 | 1 | 2 |
| White | 27 | 2 | 25 |
| Two or more races | 22 | 3 | 19 |
| Race Unknown | 0 | 0 | 0 |
Student Age Distribution
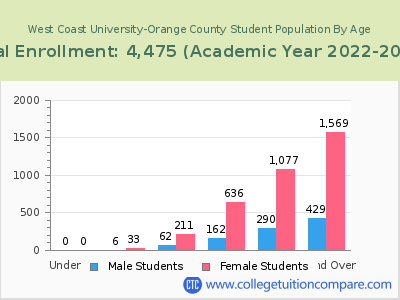
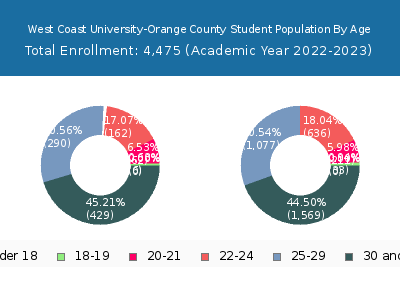
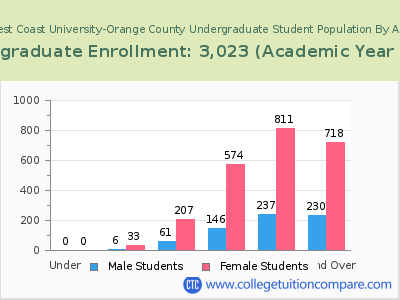
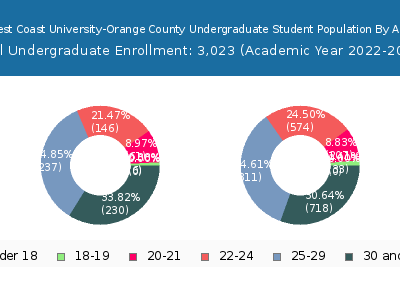
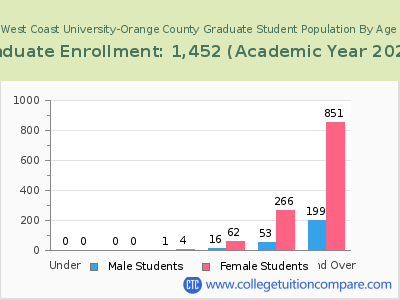
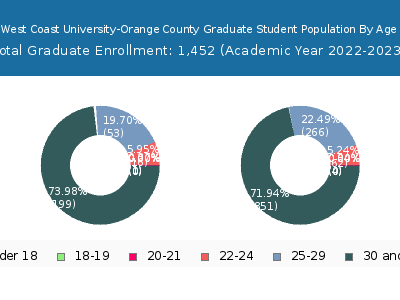
There are 1,110 students under 25 years old, and 3,365 students over 25 years old out of 4,475 total students.
West Coast University-Orange County has 1,027 undergraduate students aged under 25 and 1,996 students aged 25 and over.
It has 83 graduate students aged under 25 and 1,369 students aged 25 and over.
| Age | Total | Men | Women |
|---|
| Age | Total | Men | Women |
|---|
| Age | Total | Men | Women |
|---|
Online Student Enrollment
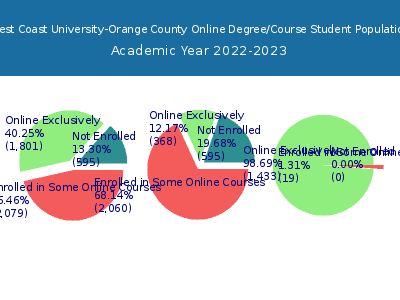
Distance learning, also called online education, is very attractive to students, especially who want to continue education and work in field. At West Coast University-Orange County, 1,801 students are enrolled exclusively in online courses and 2,079 students are enrolled in some online courses.
1,783 students lived in California or jurisdiction in which the school is located are enrolled exclusively in online courses and 18 students live in other State or outside of the United States.
| All Students | Enrolled Exclusively Online Courses | Enrolled in Some Online Courses | |
|---|---|---|---|
| All Students | 4,475 | 1,801 | 2,079 |
| Undergraduate | 3,023 | 368 | 2,060 |
| Graduate | 1,452 | 1,433 | 19 |
| California Residents | Other States in U.S. | Outside of U.S. | |
|---|---|---|---|
| All Students | 1,783 | 17 | 1 |
| Undergraduate | 364 | 4 | 0 |
| Graduate | 1,419 | 13 | 1 |
Transfer-in Students (Undergraduate)
Among 3,023 enrolled in undergraduate programs, 296 students have transferred-in from other institutions. The percentage of transfer-in students is 9.79%.172 students have transferred in as full-time status and 124 students transferred in as part-time status.
| Number of Students | |
|---|---|
| Regular Full-time | 2,115 |
| Transfer-in Full-time | 172 |
| Regular Part-time | 612 |
| Transfer-in Part-time | 124 |
