Student Population by Gender
Paul Mitchell the School-Michigan has a total of 206 enrolled students for the academic year 2022-2023. All 206 students are enrolled into undergraduate programs.
By gender, 3 male and 203 female students (the male-female ratio is 1:99) are attending the school. The gender distribution is based on the 2022-2023 data.
| Undergraduate | |
|---|---|
| Total | 206 |
| Men | 3 |
| Women | 203 |
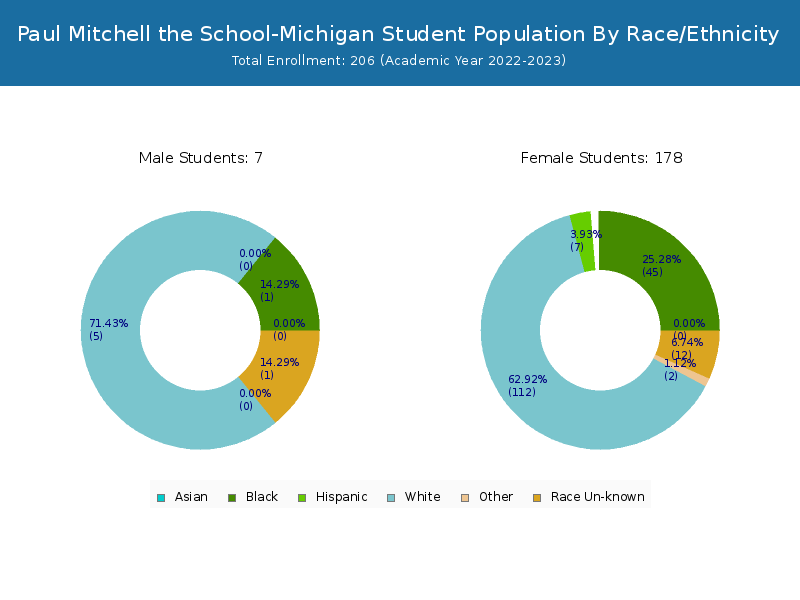
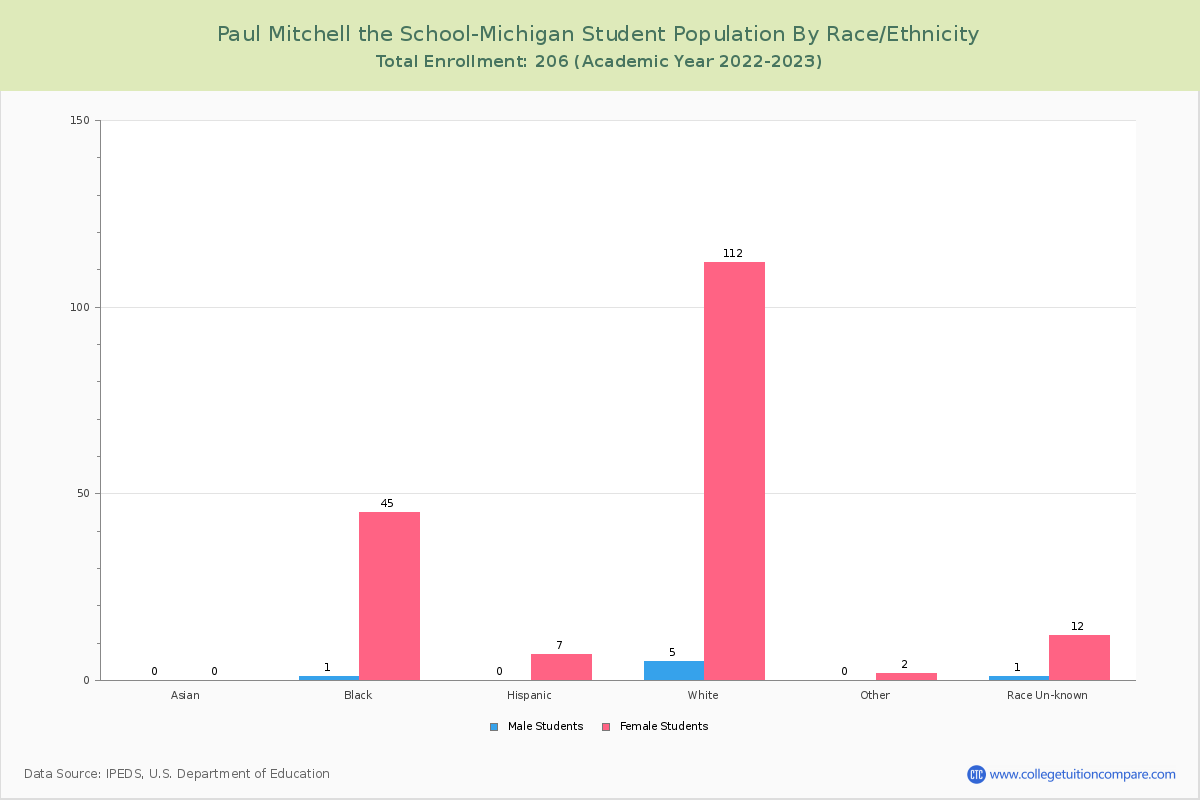
Student Distribution by Race/Ethnicity
By race/ethnicity, 117 White, 61 Black, and 1 Asian students out of a total of 206 are attending at Paul Mitchell the School-Michigan. Comprehensive enrollment statistic data by race/ethnicity is shown in the next chart (Academic year 2022-2023 data).
| Race | Total | Men | Women |
|---|---|---|---|
| American Indian or Native American | 0 | 0 | 0 |
| Asian | 1 | 0 | 1 |
| Black | 61 | 1 | 60 |
| Hispanic | 4 | 0 | 4 |
| Native Hawaiian or Other Pacific Islanders | 0 | 0 | 0 |
| White | 117 | 2 | 115 |
| Two or more races | 4 | 0 | 4 |
| Race Unknown | 19 | 0 | 19 |
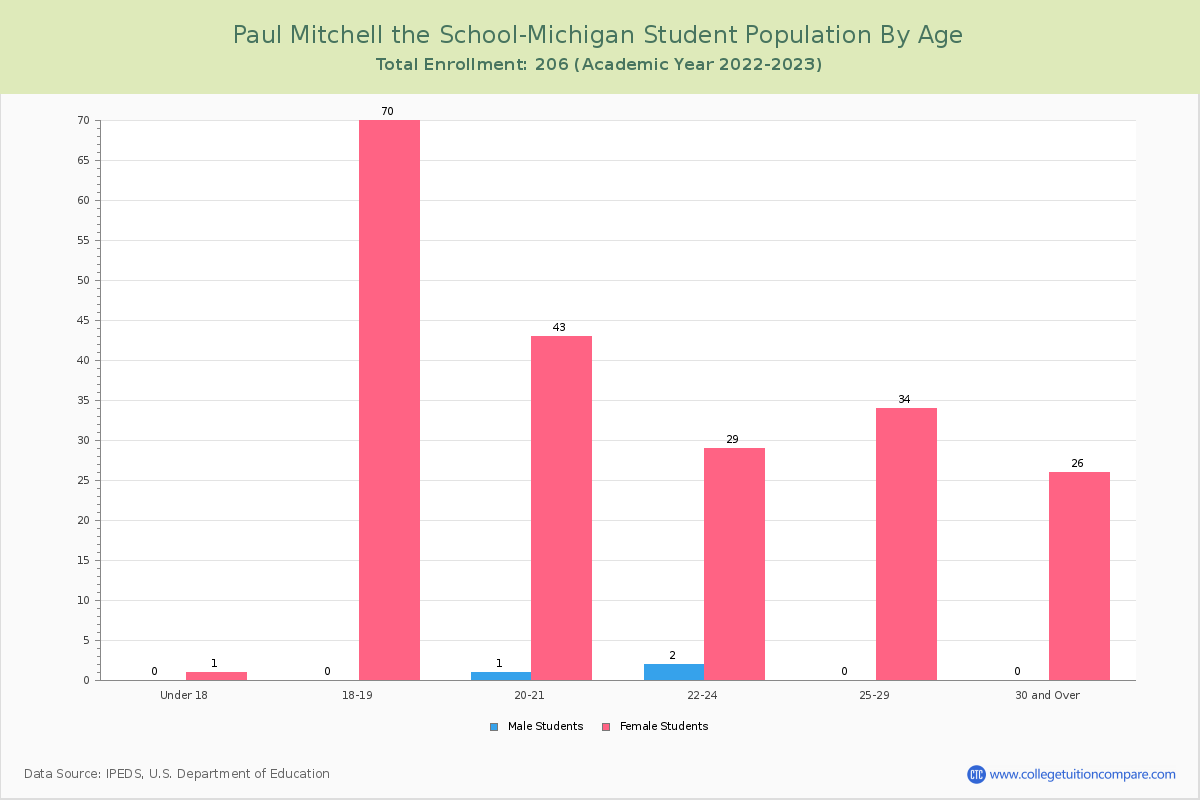
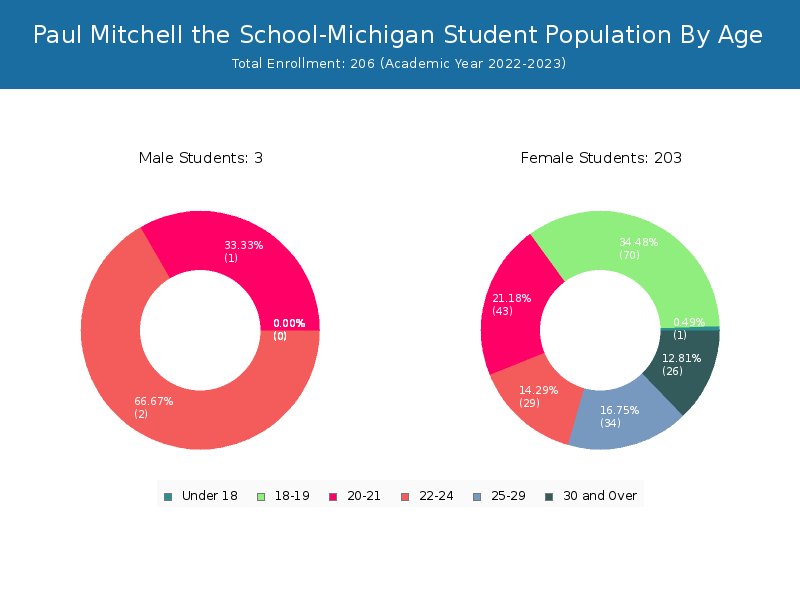
Student Age Distribution
There are 146 students under 25 years old, and 60 students over 25 years old out of 206 total students.
| Age | Total | Men | Women |
|---|---|---|---|
| Under 18 | 1 | 1 | 0 |
| 18-19 | 70 | 70 | 0 |
| 20-21 | 44 | 43 | 1 |
| 22-24 | 31 | 29 | 2 |
| 25-29 | 34 | 34 | 0 |
| 30-34 | 15 | 15 | 0 |
| 35-39 | 5 | 5 | 0 |
| 40-49 | 4 | 4 | 0 |
| 50-64 | 2 | 2 | 0 |