Graduation Rates in Reasonable Completion Time
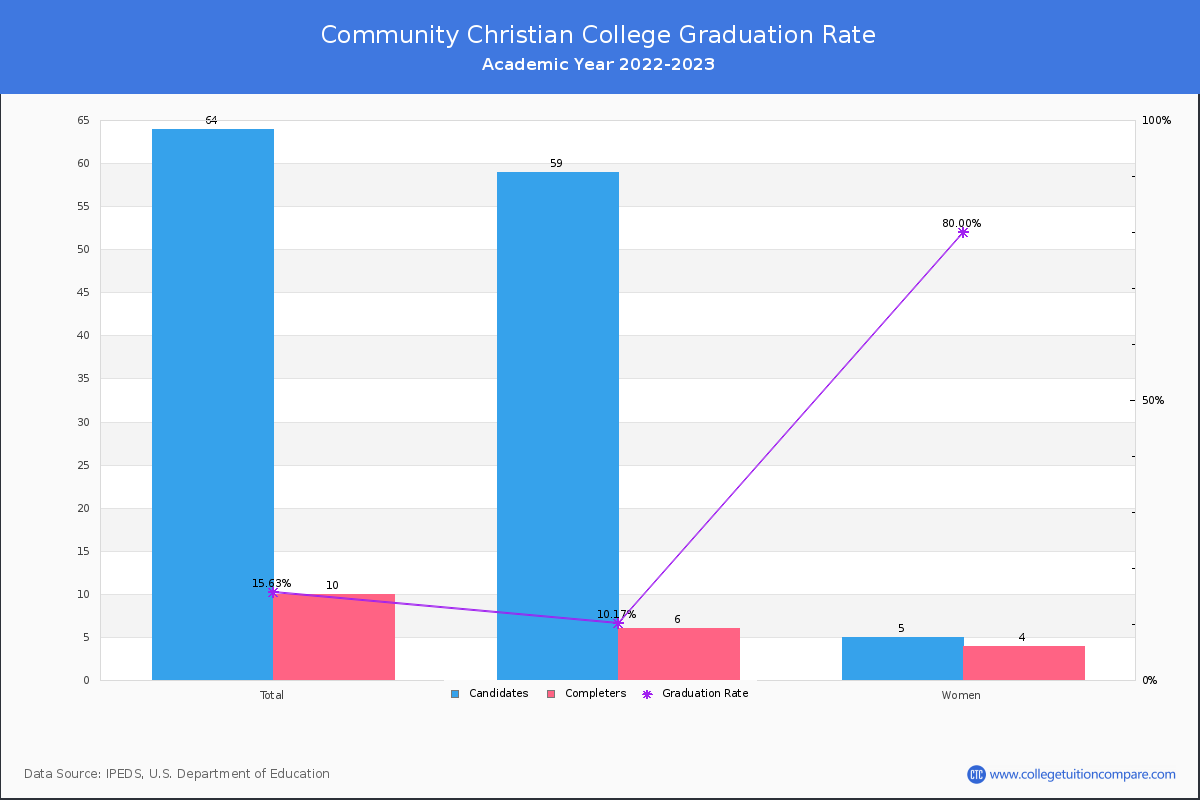
For the academic year 2022-2023, 10 students out of 64 candidates have completed their courses within 150% normal time (i.e. in 3 years for 2-year Associate degree) at Community Christian College.
By gender, 6 male and 4 female students graduated the school last year completing their jobs in the period. Its graduation rate is lower than the average rate when comparing similar colleges' rate of 23.00% (private (not-for-profit) large Associate's college).
| Candidates | Completers | Graduation Rates | |
|---|---|---|---|
| Total | 64 | 10 | 15.63% |
| Men | 59 | 6 | 10.17% |
| Women | 5 | 4 | 80.00% |
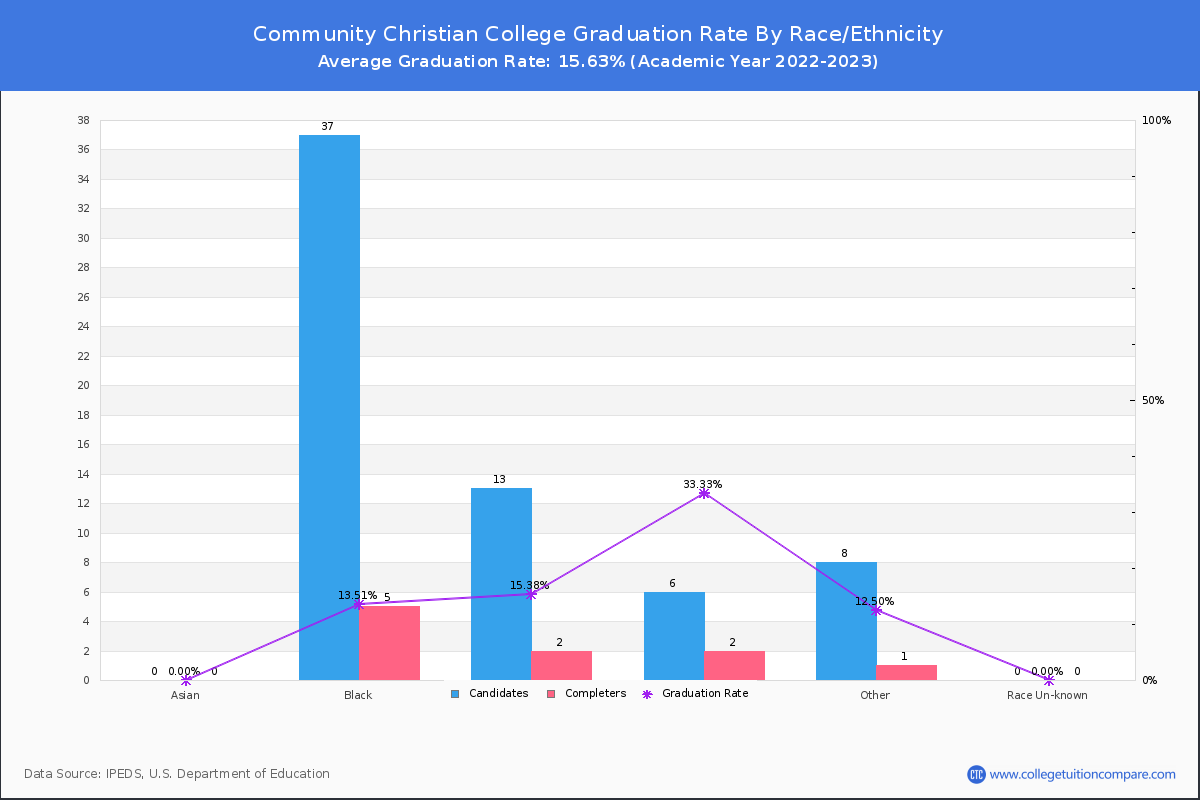
Graduation Rate By Race/Ethnicity
The following table shows graduation rate by race and at Community Christian College.
- Black (Non-Hispanic): 13.51%
- Hispanic: 15.38%
- White: 33.33%
- Native Hawaiian or Other Pacific Islander: 0.00%
- Two or More Race: 14.29%
| Total | Male | Female | |
|---|---|---|---|
| Black (Non-Hispanic) | 13.51%(5/37) | 11.11%(4/36) | 100.00%(1/1) |
| Hispanic | 15.38%(2/13) | - | 66.67%(2/3) |
| White | 33.33%(2/6) | 20.00%(1/5) | 100.00%(1/1) |
| Native Hawaiian or Other Pacific Islander | 0.00%(-/1) | - | - |
| Two or More Race | 14.29%(1/7) | 14.29%(1/7) | - |
Transfer-out and Retention Rates
At CCC, the transfer-out rate is 43.75%. Its transfer-out rate is around the average rate when comparing similar colleges' rate of 40.00%.
CCC's retention rate is 35% for full-time students and 57 % for part-time students last year. Its retention rate is relatively lower than the average rate when comparing similar colleges' rate of 45.00%.