Graduation Rates in Reasonable Completion Time
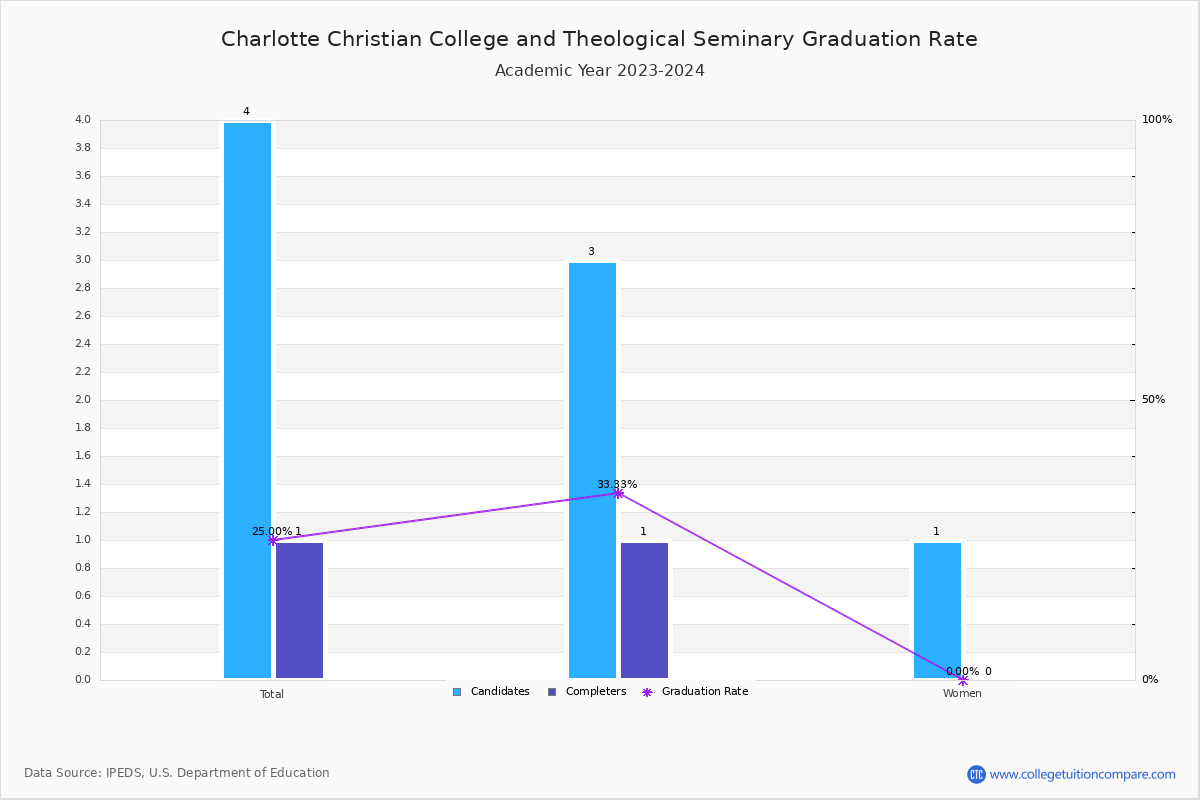
For the academic year 2022-2023, 1 students out of 4 candidates have completed their courses within 150% normal time (i.e. in 6 years for 4-year BS degree) at Charlotte Christian College and Theological Seminary.
By gender, 1 male and 0 female students graduated the school last year completing their jobs in the period. Its graduation rate is lower than the average rate when comparing similar colleges' rate of 47.47% (private (not-for-profit) faith-related institution).
| Candidates | Completers | Graduation Rates | |
|---|---|---|---|
| Total | 4 | 1 | 25.00% |
| Men | 3 | 1 | 33.33% |
| Women | 1 | 0 | 0.00% |
Graduation Rate By Race/Ethnicity
The following table shows graduation rate by race and at Charlotte Christian College and Theological Seminary.
- Asian: 0.00%
- Black (Non-Hispanic): 0.00%
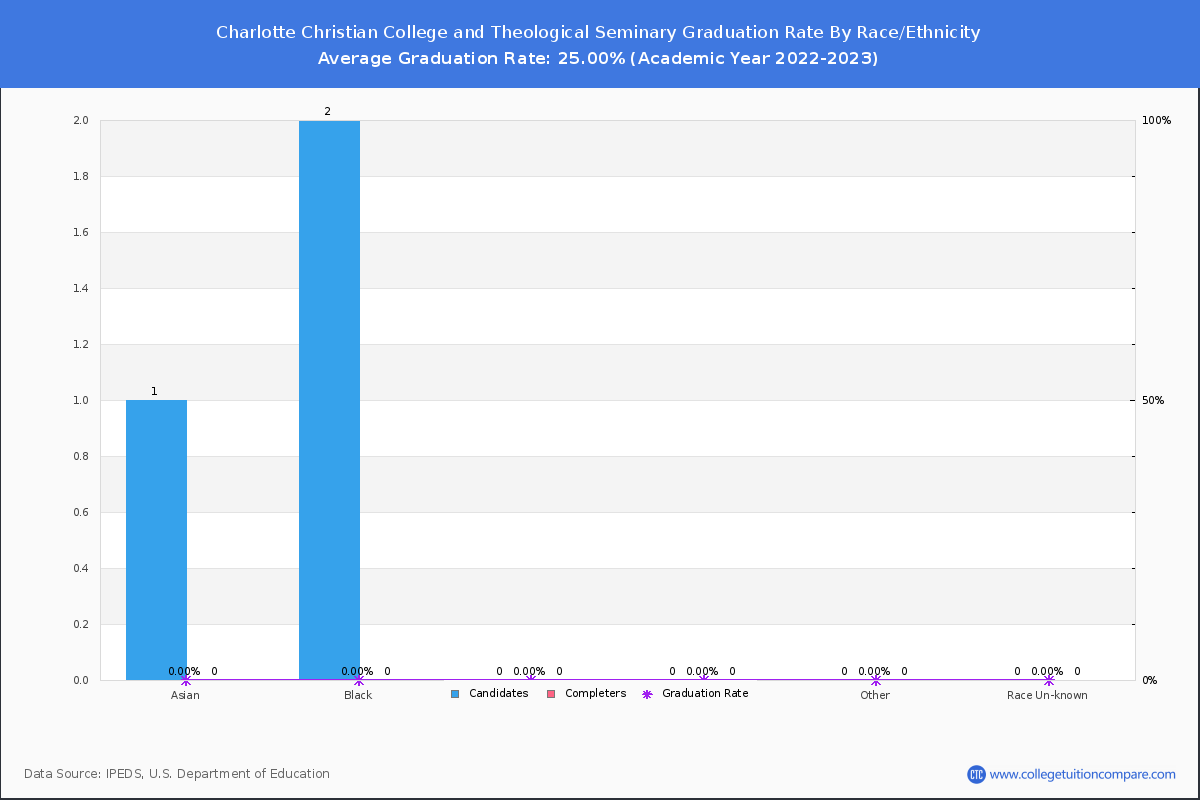
| Total | Male | Female | |
|---|---|---|---|
| Asian | 0.00%(-/1) | - | - |
| Black (Non-Hispanic) | 0.00%(-/2) | - | - |
Non-Resident Alien Graduation Rate
A non-resident alien student is not a US citizen/green card holder and studies with a student visa, such as an F visa, in the United States. At Charlotte Christian College and Theological Seminary, 1 of 1 non-resident alien students completed their studies and the graduation rate was 100.00%.