Student Population by Gender
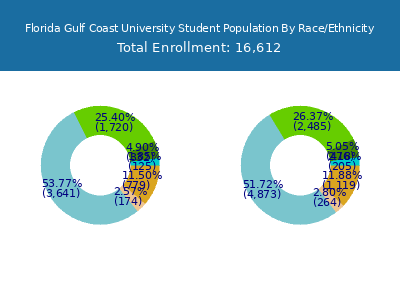
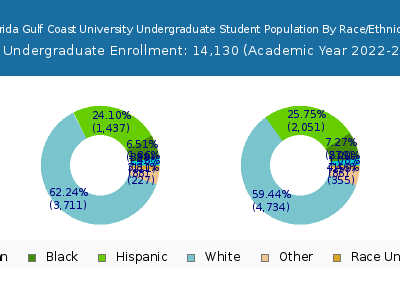
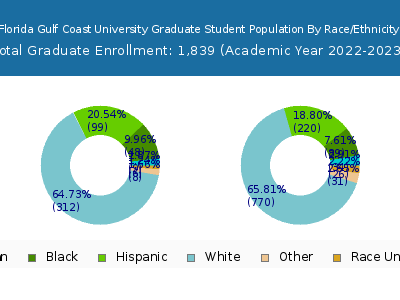
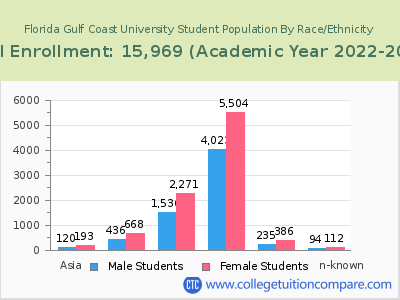
Florida Gulf Coast University has a total of 15,969 enrolled students for the academic year 2022-2023. 14,130 students have enrolled in undergraduate programs and 1,839 students joined graduate programs.
By gender, 6,755 male and 9,214 female students (the male-female ratio is 42:58) are attending the school. The gender distribution is based on the 2022-2023 data.
| Total | Undergraduate | Graduate | |
|---|---|---|---|
| Total | 15,969 | 14,130 | 1,839 |
| Men | 6,755 | 6,165 | 590 |
| Women | 9,214 | 7,965 | 1,249 |
Student Distribution by Race/Ethnicity
| Race | Total | Men | Women |
|---|---|---|---|
| American Indian or Native American | 35 | 15 | 20 |
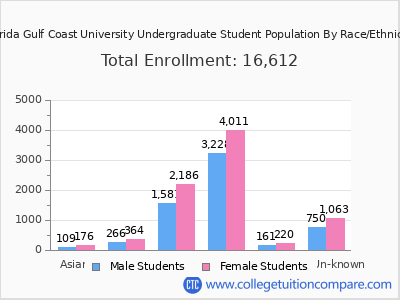
| Asian | 324 | 124 | 200 |
| Black | 991 | 382 | 609 |
| Hispanic | 3,775 | 1,573 | 2,202 |
| Native Hawaiian or Other Pacific Islanders | 13 | 1 | 12 |
| White | 9,585 | 4,100 | 5,485 |
| Two or more races | 548 | 218 | 330 |
| Race Unknown | 335 | 171 | 164 |
| Race | Total | Men | Women |
|---|---|---|---|
| American Indian or Native American | 33 | 14 | 19 |
| Asian | 273 | 107 | 166 |
| Black | 846 | 335 | 511 |
| Hispanic | 3,430 | 1,462 | 1,968 |
| Native Hawaiian or Other Pacific Islanders | 13 | 1 | 12 |
| White | 8,443 | 3,739 | 4,704 |
| Two or more races | 487 | 207 | 280 |
| Race Unknown | 288 | 155 | 133 |
| Race | Total | Men | Women |
|---|---|---|---|
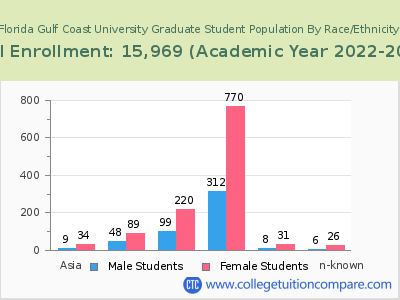
| American Indian or Native American | 5 | 3 | 2 |
| Asian | 11 | 3 | 8 |
| Black | 71 | 28 | 43 |
| Hispanic | 291 | 109 | 182 |
| Native Hawaiian or Other Pacific Islanders | 0 | 0 | 0 |
| White | 661 | 327 | 334 |
| Two or more races | 33 | 20 | 13 |
| Race Unknown | 41 | 23 | 18 |
Student Age Distribution
| Age | Total | Men | Women |
|---|---|---|---|
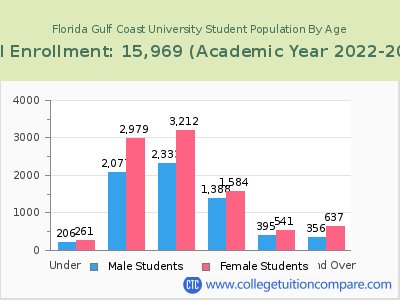
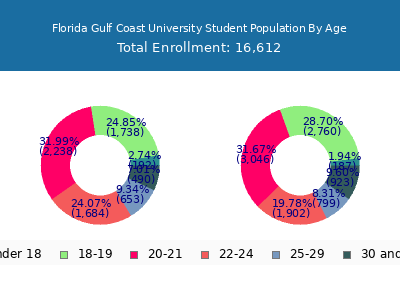
| Under 18 | 467 | 261 | 206 |
| 18-19 | 5,056 | 2,979 | 2,077 |
| 20-21 | 5,545 | 3,212 | 2,333 |
| 22-24 | 2,972 | 1,584 | 1,388 |
| 25-29 | 936 | 541 | 395 |
| 30-34 | 426 | 251 | 175 |
| 35-39 | 327 | 215 | 112 |
| 40-49 | 210 | 151 | 59 |
| 50-64 | 30 | 20 | 10 |
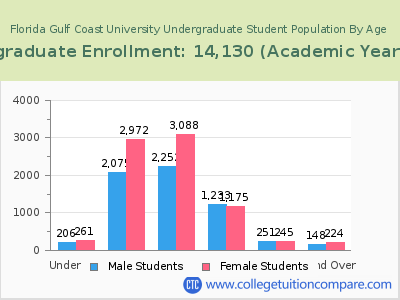
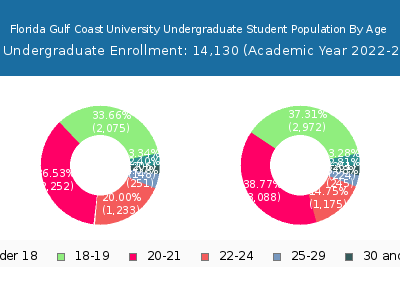
| Age | Total | Men | Women |
|---|---|---|---|
| Under 18 | 467 | 261 | 206 |
| 18-19 | 5,047 | 2,972 | 2,075 |
| 20-21 | 5,340 | 3,088 | 2,252 |
| 22-24 | 2,408 | 1,175 | 1,233 |
| 25-29 | 496 | 245 | 251 |
| 30-34 | 172 | 88 | 84 |
| 35-39 | 120 | 77 | 43 |
| 40-49 | 72 | 54 | 18 |
| 50-64 | 8 | 5 | 3 |
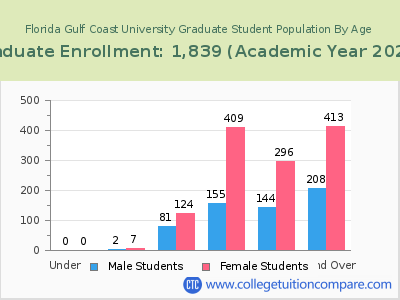
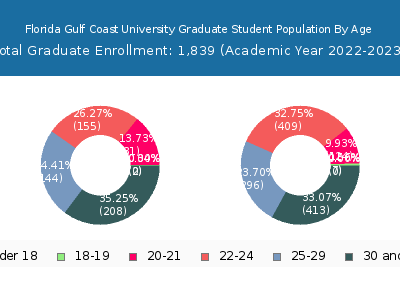
| Age | Total | Men | Women |
|---|
Online Student Enrollment
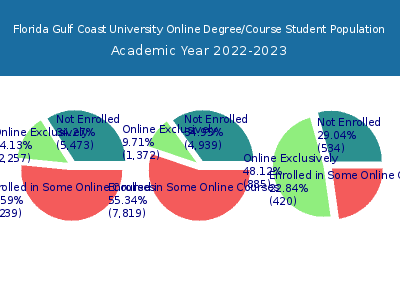
Distance learning, also called online education, is very attractive to students, especially who want to continue education and work in field. At Florida Gulf Coast University, 2,257 students are enrolled exclusively in online courses and 8,239 students are enrolled in some online courses.
2,153 students lived in Florida or jurisdiction in which the school is located are enrolled exclusively in online courses and 104 students live in other State or outside of the United States.
| All Students | Enrolled Exclusively Online Courses | Enrolled in Some Online Courses | |
|---|---|---|---|
| All Students | 15,969 | 2,257 | 8,239 |
| Undergraduate | 14,130 | 1,372 | 7,819 |
| Graduate | 1,839 | 885 | 420 |
| Florida Residents | Other States in U.S. | Outside of U.S. | |
|---|---|---|---|
| All Students | 2,153 | 102 | 2 |
| Undergraduate | 1,304 | 67 | 1 |
| Graduate | 849 | 35 | 1 |
Transfer-in Students (Undergraduate)
Among 14,130 enrolled in undergraduate programs, 1,158 students have transferred-in from other institutions. The percentage of transfer-in students is 8.20%.872 students have transferred in as full-time status and 286 students transferred in as part-time status.
| Number of Students | |
|---|---|
| Regular Full-time | 10,465 |
| Transfer-in Full-time | 872 |
| Regular Part-time | 2,507 |
| Transfer-in Part-time | 286 |
