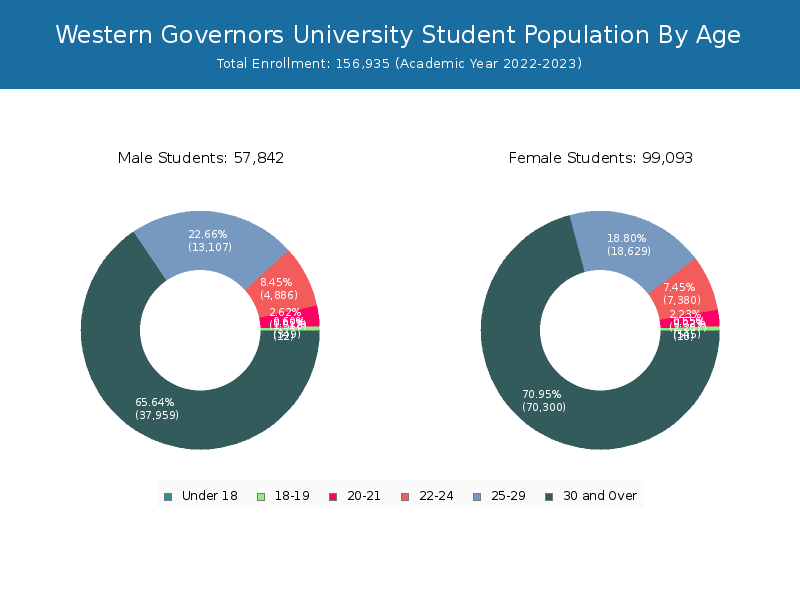
Student Population by Gender
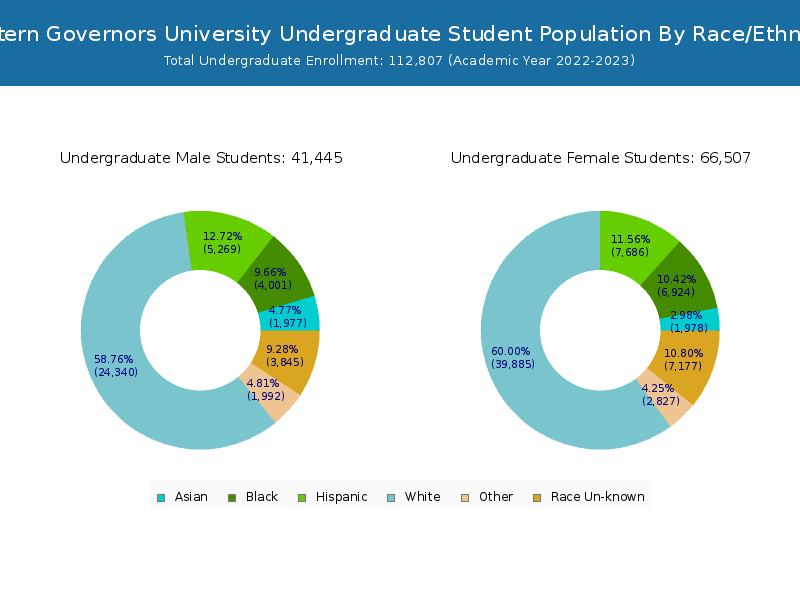
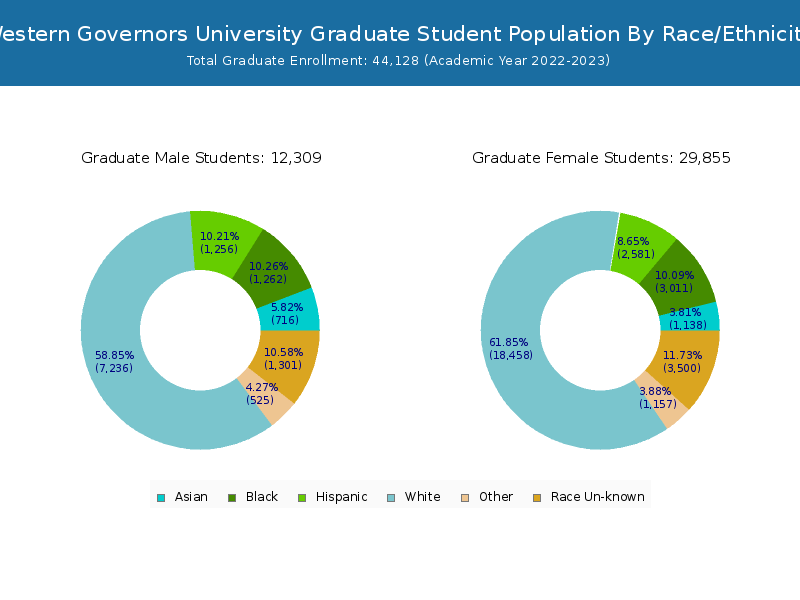
Western Governors University has a total of 156,935 enrolled students for the academic year 2022-2023. 112,807 students have enrolled in undergraduate programs and 44,128 students joined graduate programs.
By gender, 57,842 male and 99,093 female students (the male-female ratio is 37:63) are attending the school. The gender distribution is based on the 2022-2023 data.
| Total | Undergraduate | Graduate | |
|---|---|---|---|
| Total | 156,935 | 112,807 | 44,128 |
| Men | 57,842 | 45,265 | 12,577 |
| Women | 99,093 | 67,542 | 31,551 |
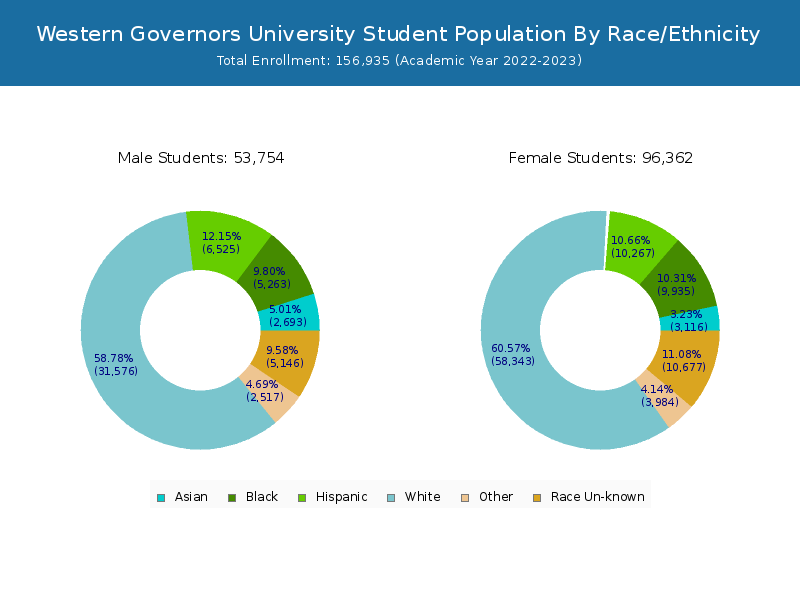
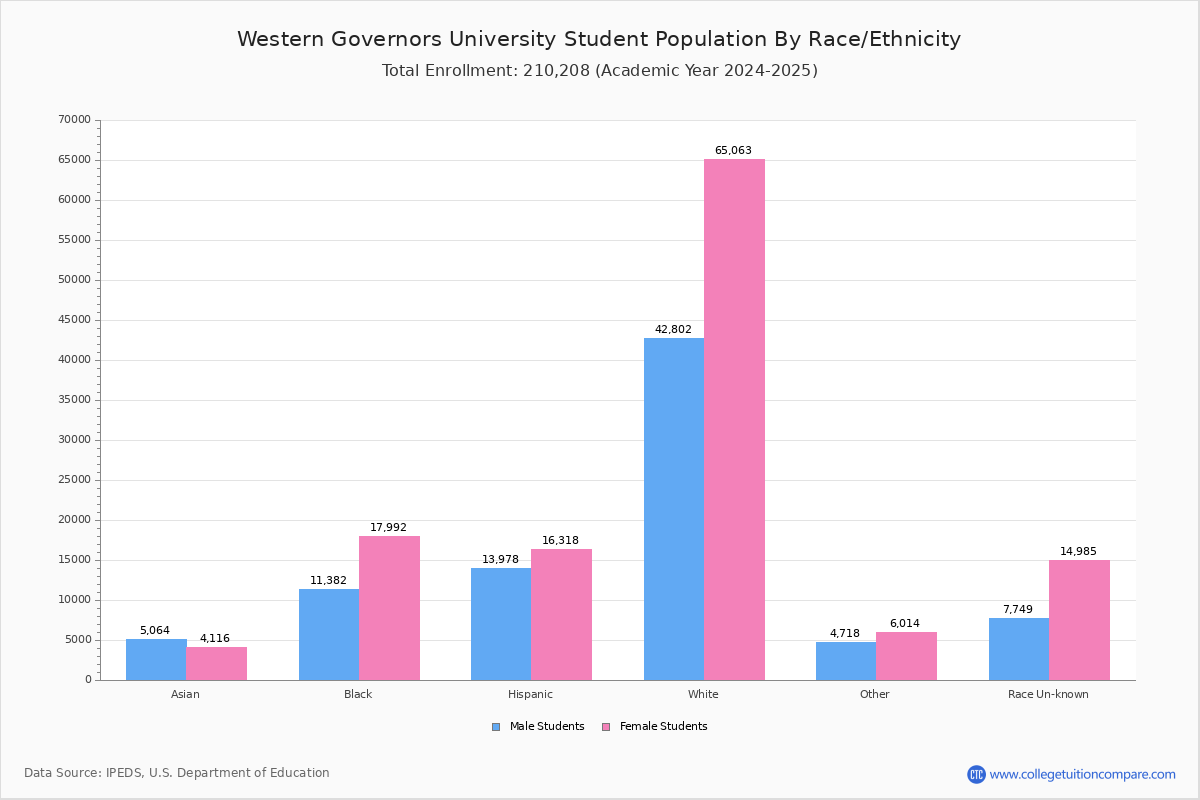
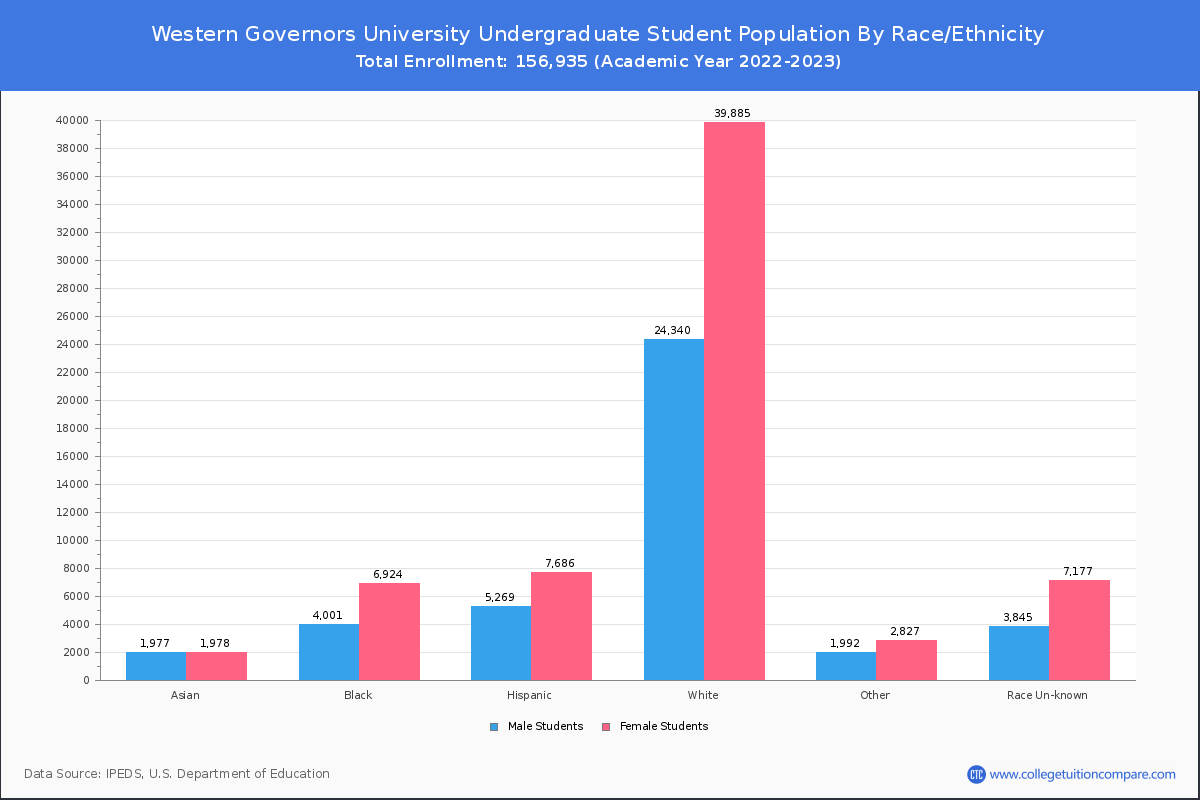
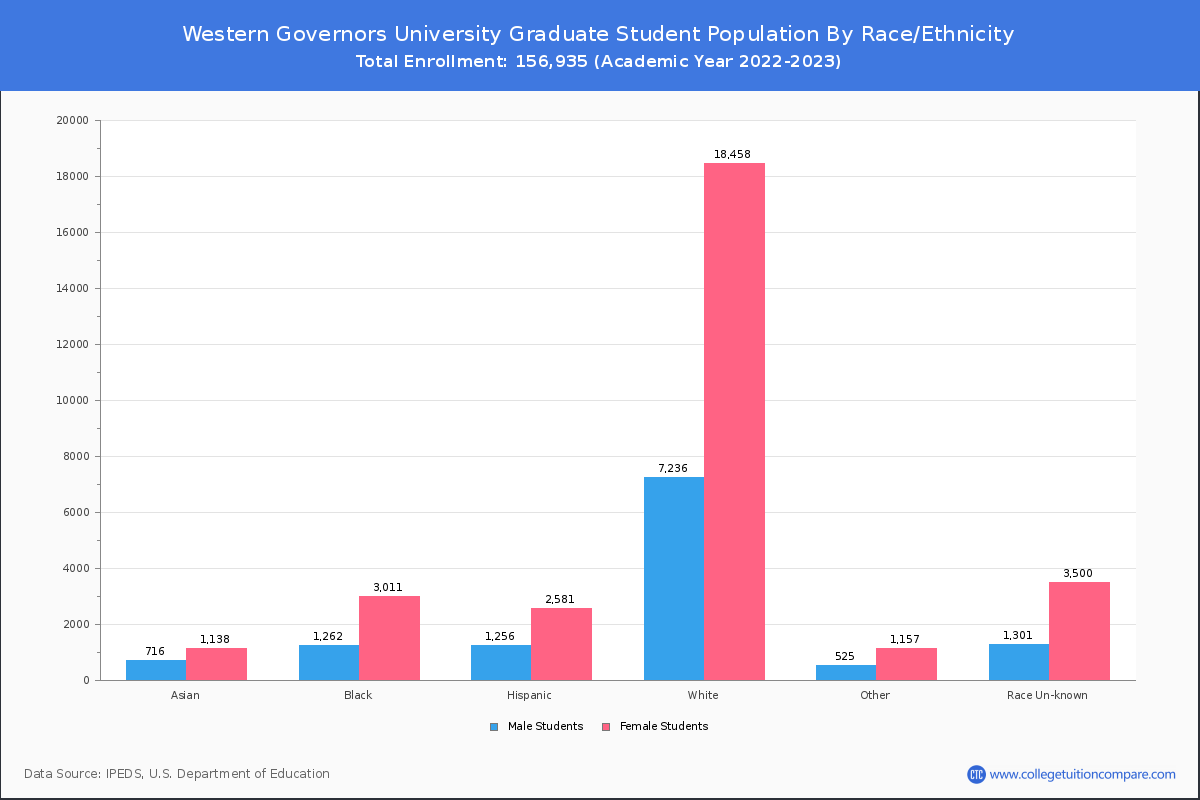
Student Distribution by Race/Ethnicity
By race/ethnicity, 93,418 White, 17,422 Black, and 6,203 Asian students out of a total of 156,935 are attending at Western Governors University. Comprehensive enrollment statistic data by race/ethnicity is shown in the next chart (Academic year 2022-2023 data).
| Race | Total | Men | Women |
|---|---|---|---|
| American Indian or Native American | 1,682 | 583 | 1,099 |
| Asian | 6,203 | 2,975 | 3,228 |
| Black | 17,422 | 6,346 | 11,076 |
| Hispanic | 19,551 | 7,953 | 11,598 |
| Native Hawaiian or Other Pacific Islanders | 760 | 283 | 477 |
| White | 93,418 | 32,853 | 60,565 |
| Two or more races | 4,743 | 1,921 | 2,822 |
| Race Unknown | 13,104 | 4,905 | 8,199 |
| Race | Total | Men | Women |
|---|---|---|---|
| American Indian or Native American | 1,198 | 447 | 751 |
| Asian | 4,260 | 2,247 | 2,013 |
| Black | 12,629 | 4,973 | 7,656 |
| Hispanic | 15,032 | 6,464 | 8,568 |
| Native Hawaiian or Other Pacific Islanders | 562 | 229 | 333 |
| White | 65,986 | 25,505 | 40,481 |
| Two or more races | 3,571 | 1,556 | 2,015 |
| Race Unknown | 9,535 | 3,832 | 5,703 |
| Race | Total | Men | Women |
|---|---|---|---|
| American Indian or Native American | 262 | 77 | 185 |
| Asian | 1,422 | 726 | 696 |
| Black | 3,875 | 1,528 | 2,347 |
| Hispanic | 4,709 | 2,022 | 2,687 |
| Native Hawaiian or Other Pacific Islanders | 166 | 61 | 105 |
| White | 20,623 | 7,630 | 12,993 |
| Two or more races | 1,295 | 586 | 709 |
| Race Unknown | 2,200 | 893 | 1,307 |
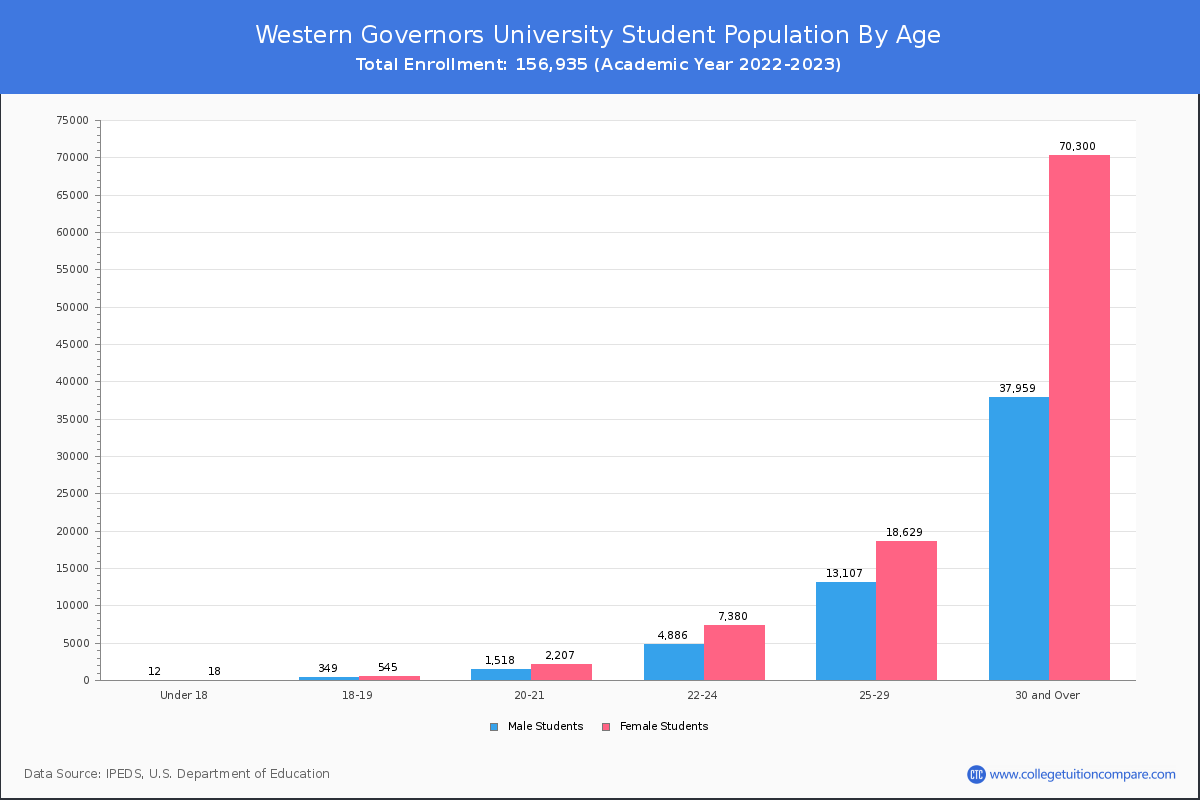
Student Age Distribution
By age, WGU has 30 students under 18 years old and 315 students over 65 years old. There are 16,915 students under 25 years old, and 139,995 students over 25 years old out of 156,935 total students.
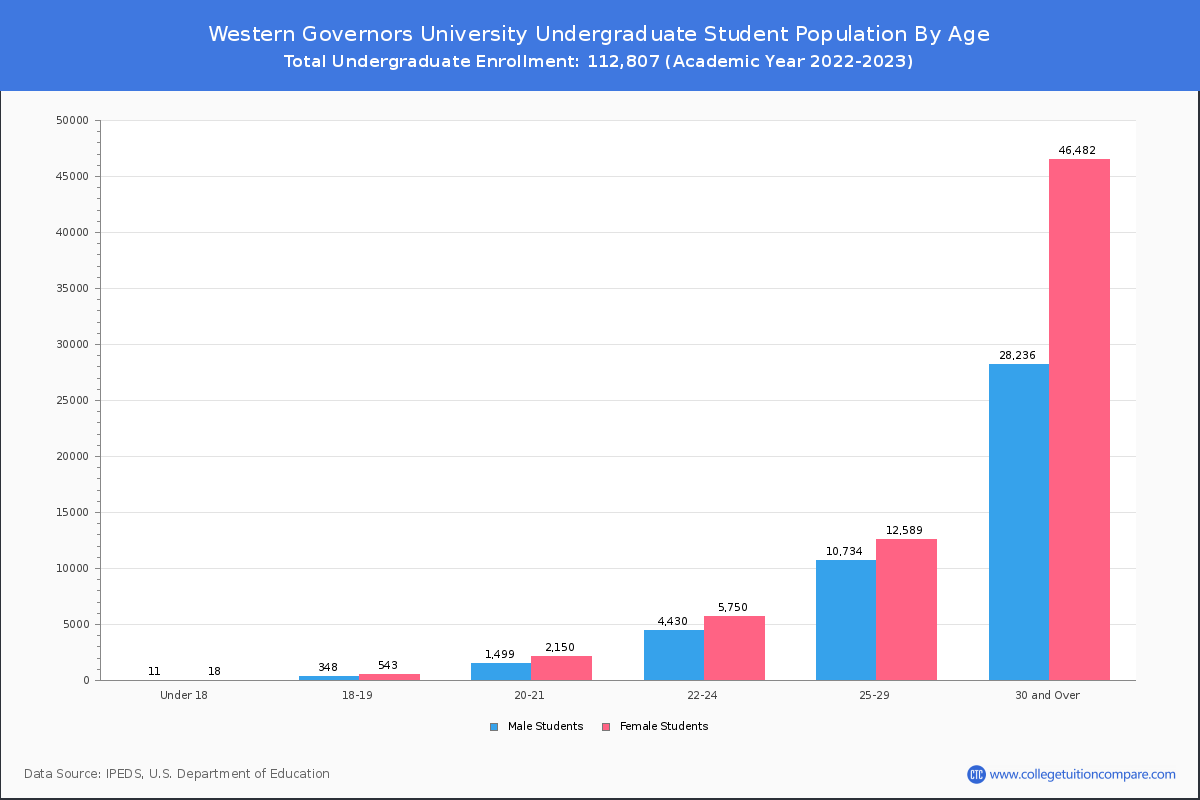
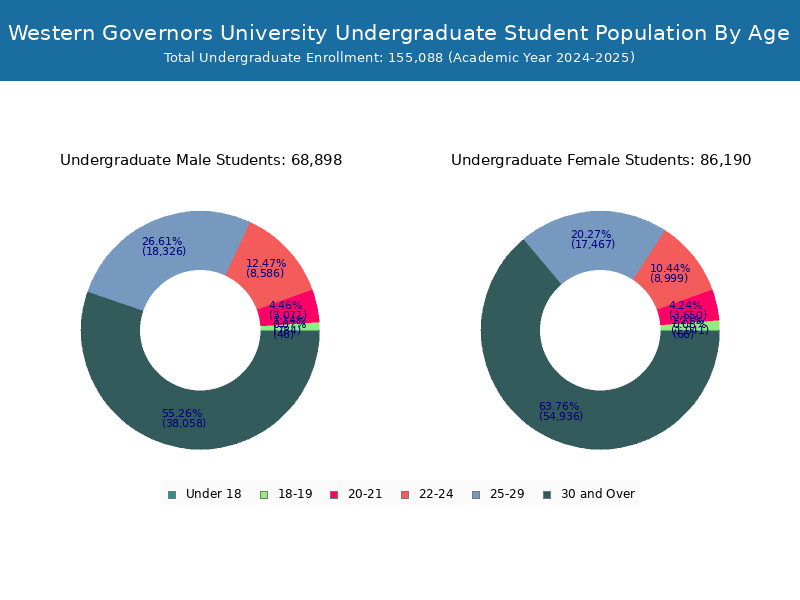
In undergraduate programs, 29 students are younger than 18 and 160 students are older than 65. WGU has 14,749 undergraduate students aged under 25 and 98,041 students aged 25 and over.
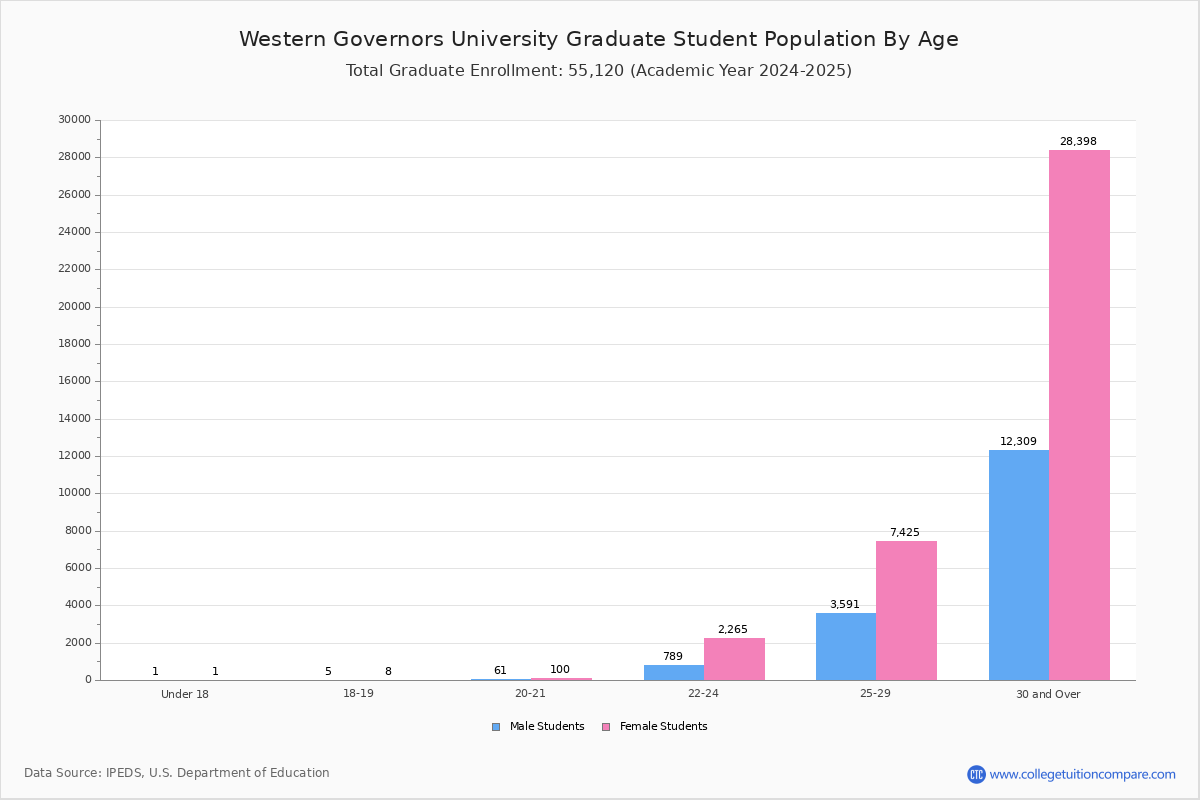
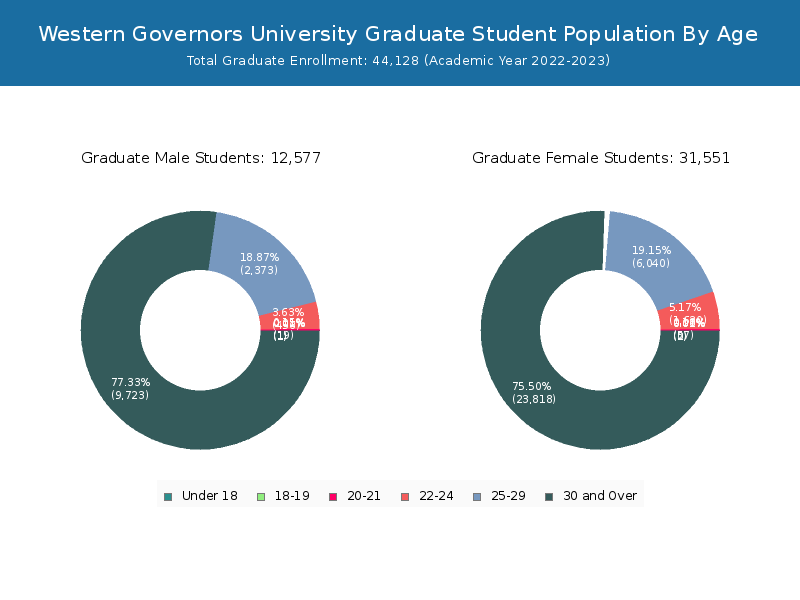
In graduate schools at WGU, 1 students are younger than 18 and 155 students are older than 65. It has 2,166 graduate students aged under 25 and 41,954 students aged 25 and over.
| Age | Total | Men | Women |
|---|---|---|---|
| Under 18 | 30 | 18 | 12 |
| 18-19 | 894 | 545 | 349 |
| 20-21 | 3,725 | 2,207 | 1,518 |
| 22-24 | 12,266 | 7,380 | 4,886 |
| 25-29 | 31,736 | 18,629 | 13,107 |
| 30-34 | 32,321 | 18,985 | 13,336 |
| 35-39 | 27,128 | 17,296 | 9,832 |
| 40-49 | 34,602 | 23,856 | 10,746 |
| 50-64 | 13,893 | 9,967 | 3,926 |
| Over 65 | 315 | 196 | 119 |
| Age | Total | Men | Women |
|---|---|---|---|
| Under 18 | 29 | 18 | 11 |
| 18-19 | 891 | 543 | 348 |
| 20-21 | 3,649 | 2,150 | 1,499 |
| 22-24 | 10,180 | 5,750 | 4,430 |
| 25-29 | 23,323 | 12,589 | 10,734 |
| 30-34 | 23,799 | 13,254 | 10,545 |
| 35-39 | 19,211 | 11,797 | 7,414 |
| 40-49 | 22,998 | 15,294 | 7,704 |
| 50-64 | 8,550 | 6,041 | 2,509 |
| Over 65 | 160 | 96 | 64 |
| Age | Total | Men | Women |
|---|---|---|---|
| Under 18 | 1 | 0 | 1 |
| 18-19 | 3 | 2 | 1 |
| 20-21 | 76 | 57 | 19 |
| 22-24 | 2,086 | 1,630 | 456 |
| 25-29 | 8,413 | 6,040 | 2,373 |
| 30-34 | 8,522 | 5,731 | 2,791 |
| 35-39 | 7,917 | 5,499 | 2,418 |
| 40-49 | 11,604 | 8,562 | 3,042 |
| 50-64 | 5,343 | 3,926 | 1,417 |
| Over 65 | 155 | 100 | 55 |
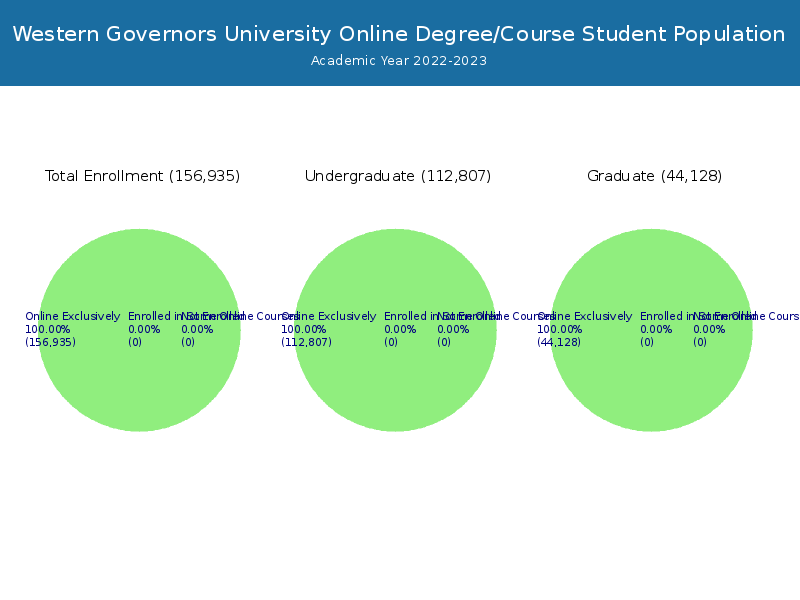
Online Student Enrollment
Distance learning, also called online education, is very attractive to students, especially who want to continue education and work in field. At Western Governors University, 156,935 students are enrolled exclusively in online courses and 0 students are enrolled in some online courses.
9,429 students lived in Utah or jurisdiction in which the school is located are enrolled exclusively in online courses and 147,506 students live in other State or outside of the United States.
| All Students | Enrolled Exclusively Online Courses | Enrolled in Some Online Courses | |
|---|---|---|---|
| All Students | 156,935 | 156,935 | 0 |
| Undergraduate | 112,807 | 112,807 | 0 |
| Graduate | 44,128 | 44,128 | 0 |
| Utah Residents | Other States in U.S. | Outside of U.S. | |
|---|---|---|---|
| All Students | 9,429 | 147,506 | 0 |
| Undergraduate | 6,574 | 106,233 | 0 |
| Graduate | 2,855 | 41,273 | 0 |
Transfer-in Students (Undergraduate)
Among 112,807 enrolled in undergraduate programs, 34,557 students have transferred-in from other institutions. The percentage of transfer-in students is 30.63%.
| Number of Students | |
|---|---|
| Regular Full-time | 78,250 |
| Transfer-in Full-time | 34,557 |