Student Population by Gender
Midwestern University-Glendale has a total of 3,782 enrolled students for the academic year 2022-2023. All 3,782 students are enrolled into graduate programs.
By gender, 1,486 male and 2,296 female students (the male-female ratio is 39:61) are attending the school. The gender distribution is based on the 2022-2023 data.
| Graduate | |
|---|---|
| Total | 3,782 |
| Men | 1,486 |
| Women | 2,296 |
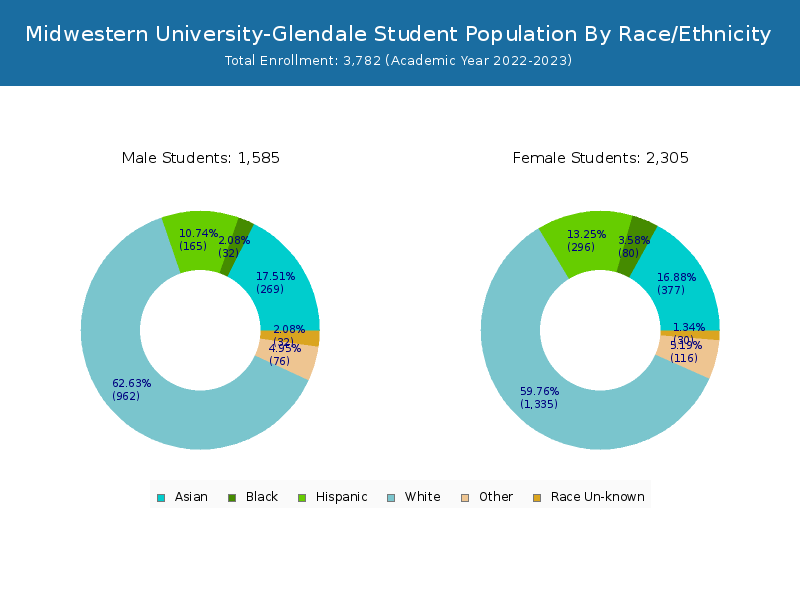
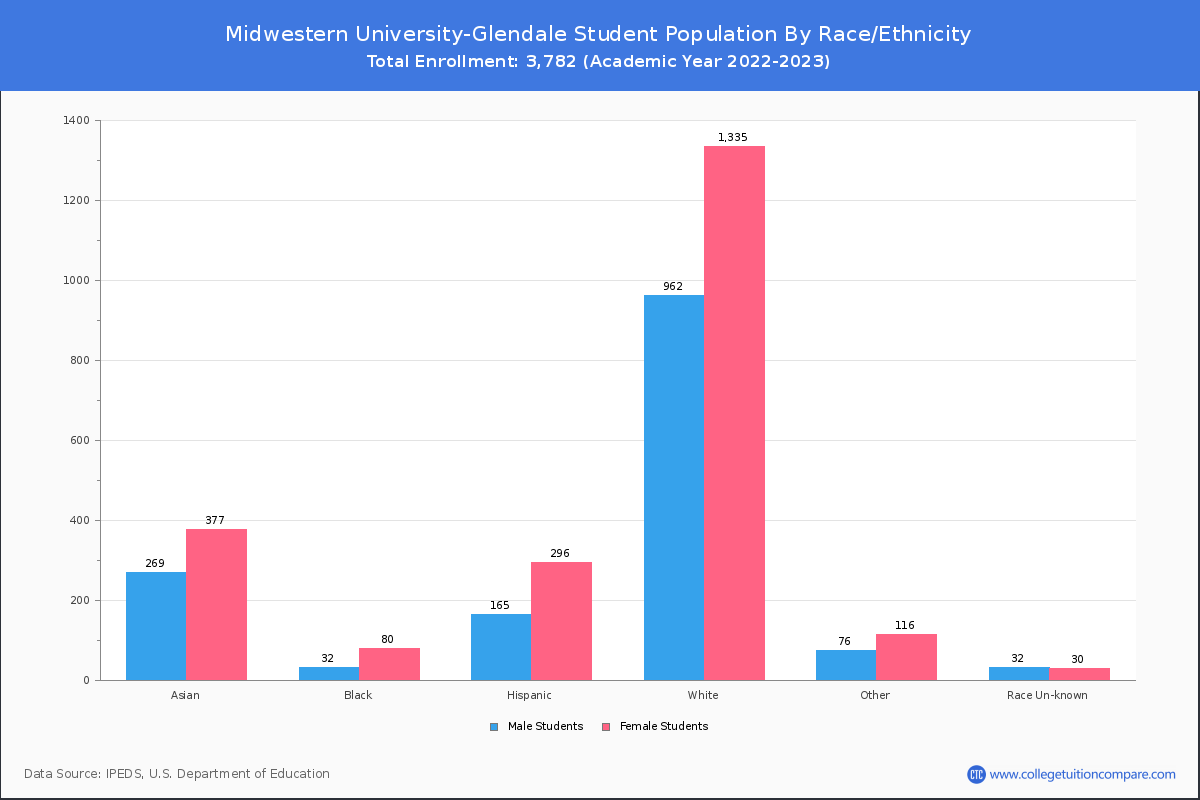
Student Distribution by Race/Ethnicity
By race/ethnicity, 2,191 White, 114 Black, and 637 Asian students out of a total of 3,782 are attending at Midwestern University-Glendale. Comprehensive enrollment statistic data by race/ethnicity is shown in the next chart (Academic year 2022-2023 data).
| Race | Total | Men | Women |
|---|---|---|---|
| American Indian or Native American | 8 | 2 | 6 |
| Asian | 637 | 259 | 378 |
| Black | 114 | 35 | 79 |
| Hispanic | 466 | 152 | 314 |
| Native Hawaiian or Other Pacific Islanders | 7 | 4 | 3 |
| White | 2,191 | 881 | 1,310 |
| Two or more races | 171 | 70 | 101 |
| Race Unknown | 53 | 25 | 28 |
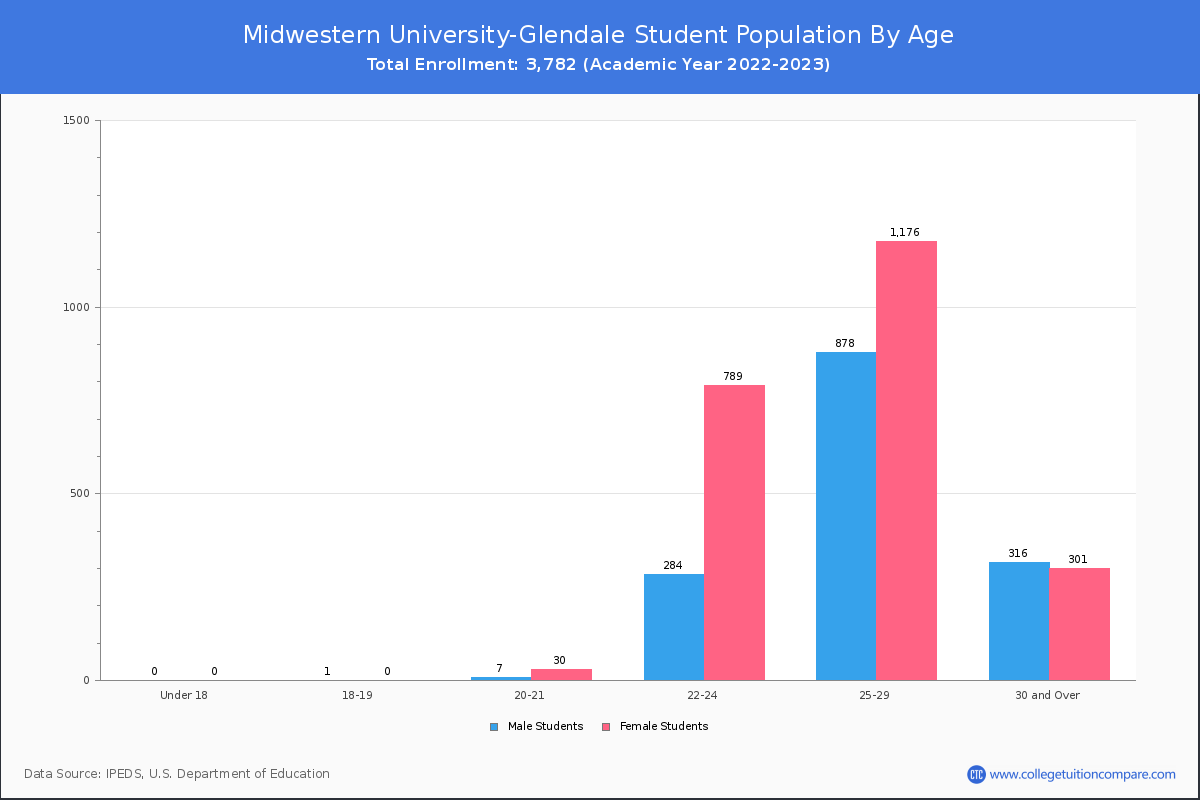
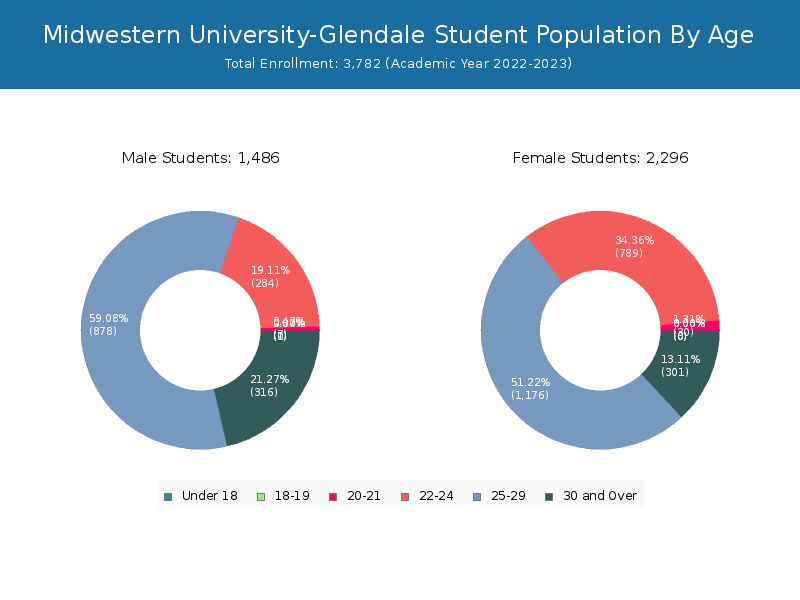
Student Age Distribution
There are 1,111 students under 25 years old, and 2,671 students over 25 years old out of 3,782 total students.
| Age | Total | Men | Women |
|---|
Online Student Enrollment
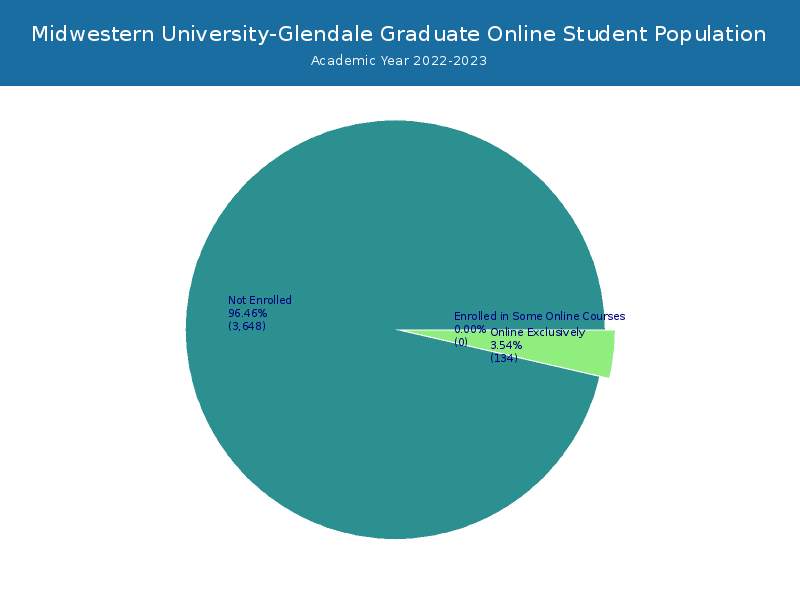
Distance learning, also called online education, is very attractive to students, especially who want to continue education and work in field. At Midwestern University-Glendale, 134 students are enrolled exclusively in online courses and 0 students are enrolled in some online courses.
53 students lived in Arizona or jurisdiction in which the school is located are enrolled exclusively in online courses and 81 students live in other State or outside of the United States.
| All Students | Enrolled Exclusively Online Courses | Enrolled in Some Online Courses | |
|---|---|---|---|
| All Students | 3,782 | 134 | 0 |
| Undergraduate | Undergraduate Program Not Offered | ||
| Graduate | 3,782 | 134 | 0 |
| Arizona Residents | Other States in U.S. | Outside of U.S. | |
|---|---|---|---|
| All Students | 53 | 81 | 0 |
| Undergraduate | - | - | - |
| Graduate | 53 | 81 | 0 |