Student Population by Gender
Kiamichi Technology Center-McAlester has a total of 568 enrolled students for the academic year 2022-2023. All 568 students are enrolled into undergraduate programs.
By gender, 305 male and 263 female students (the male-female ratio is 54:46) are attending the school. The gender distribution is based on the 2022-2023 data.
| Undergraduate | |
|---|---|
| Total | 568 |
| Men | 305 |
| Women | 263 |
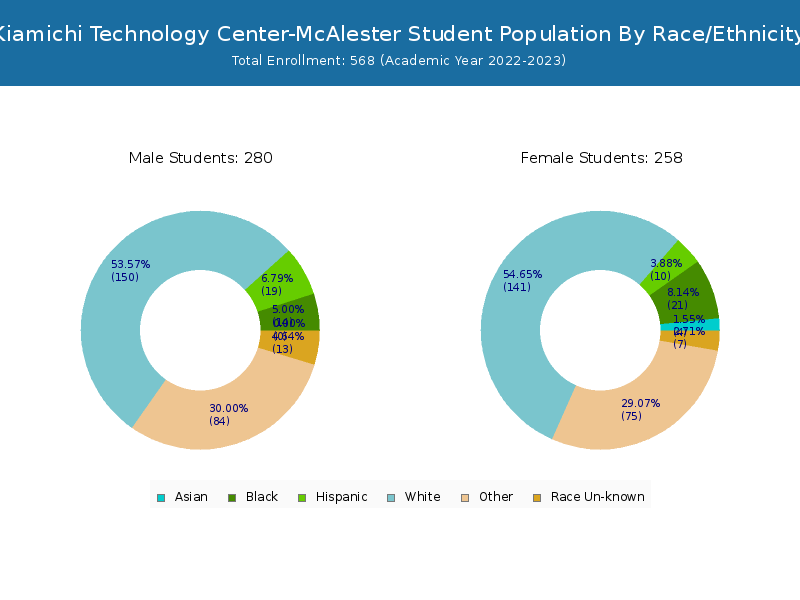
Student Distribution by Race/Ethnicity
By race/ethnicity, 301 White, 45 Black, and 4 Asian students out of a total of 568 are attending at Kiamichi Technology Center-McAlester. Comprehensive enrollment statistic data by race/ethnicity is shown in the next chart (Academic year 2022-2023 data).
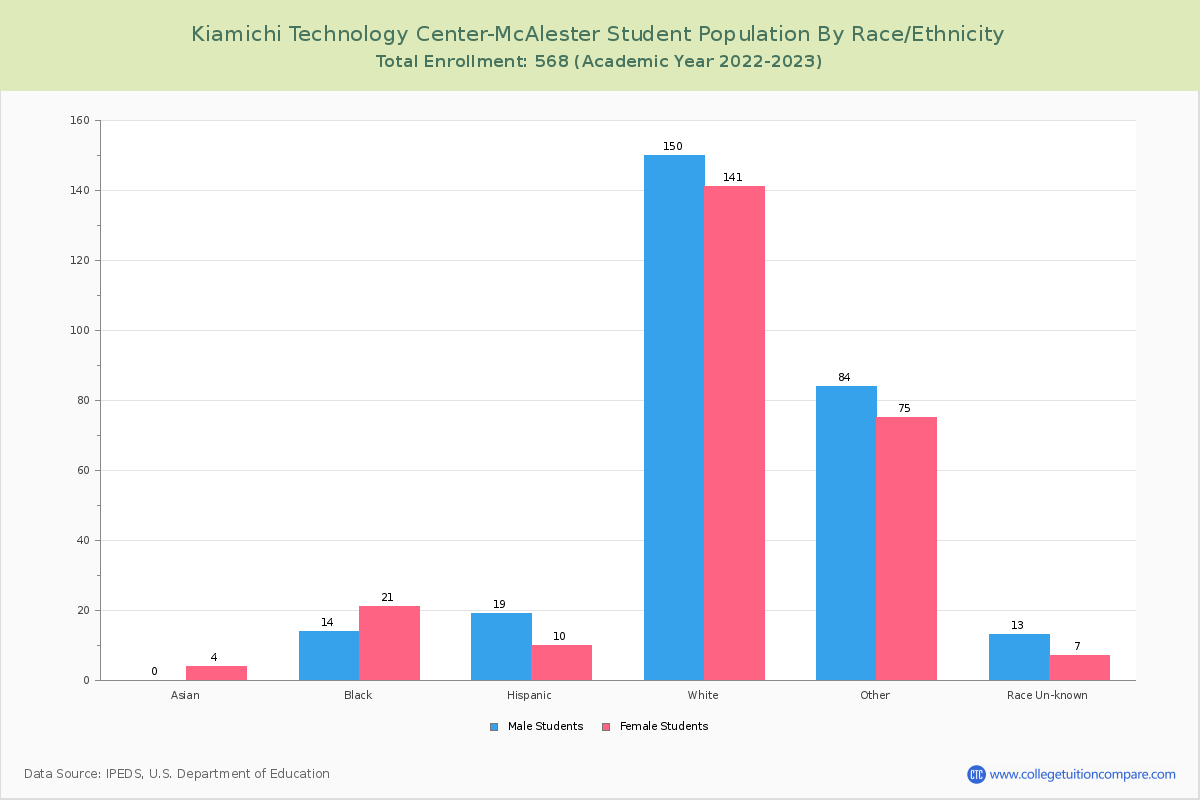
| Race | Total | Men | Women |
|---|---|---|---|
| American Indian or Native American | 134 | 74 | 60 |
| Asian | 4 | 0 | 4 |
| Black | 45 | 17 | 28 |
| Hispanic | 39 | 25 | 14 |
| Native Hawaiian or Other Pacific Islanders | 4 | 2 | 2 |
| White | 301 | 157 | 144 |
| Two or more races | 17 | 14 | 3 |
| Race Unknown | 24 | 16 | 8 |
Student Age Distribution
There are 295 students under 25 years old, and 233 students over 25 years old out of 568 total students.
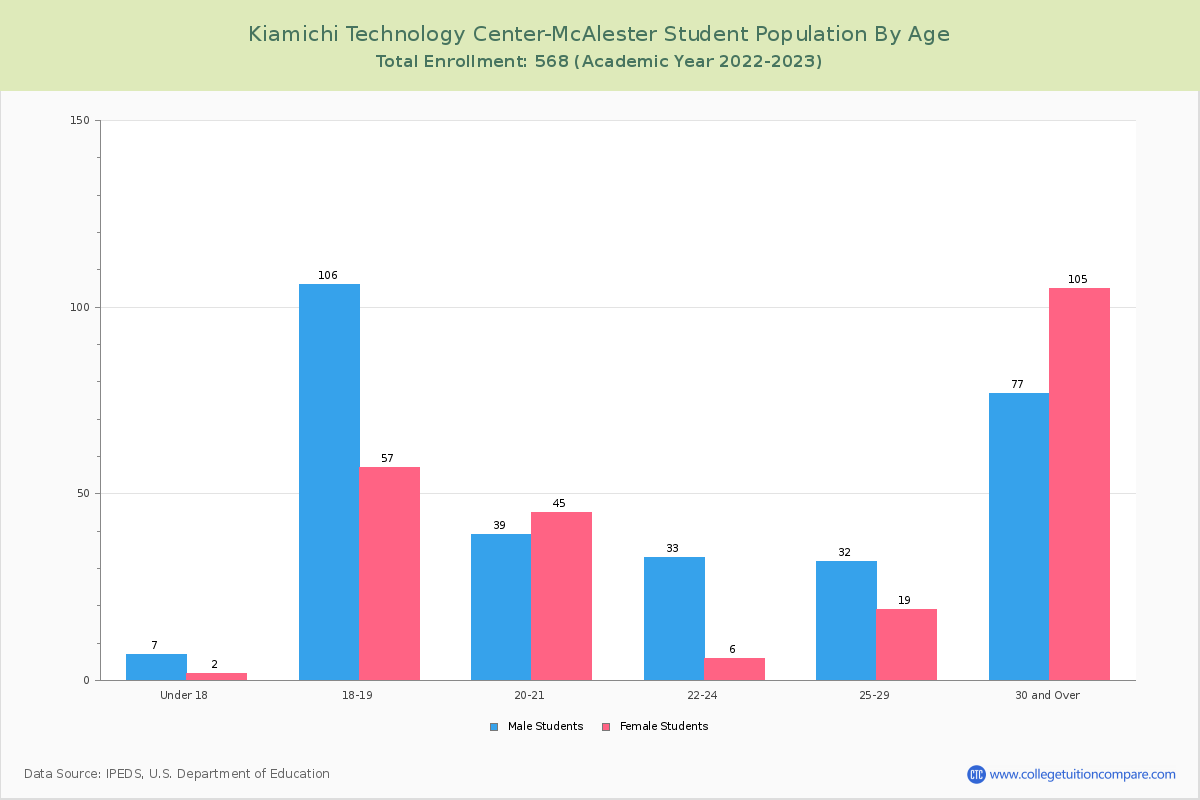
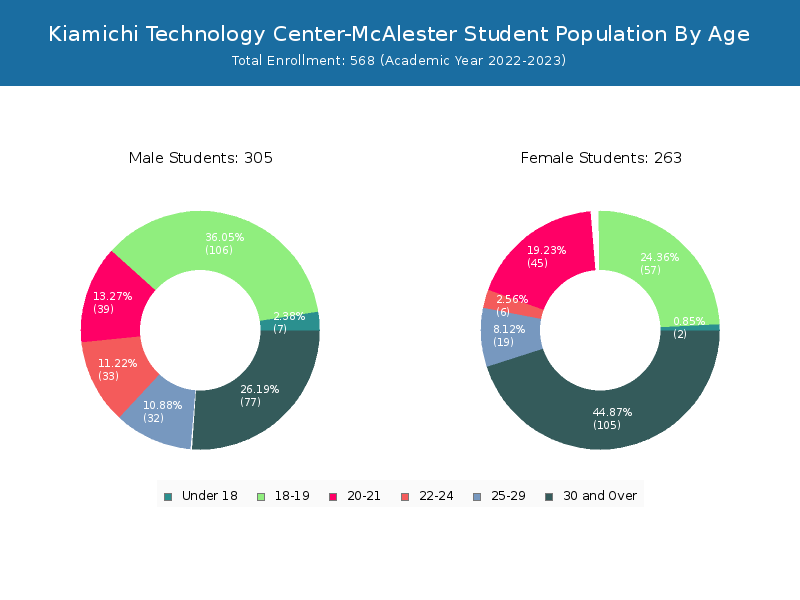
| Age | Total | Men | Women |
|---|---|---|---|
| Under 18 | 9 | 2 | 7 |
| 18-19 | 163 | 57 | 106 |
| 20-21 | 84 | 45 | 39 |
| 22-24 | 39 | 6 | 33 |
| 25-29 | 51 | 19 | 32 |
| 30-34 | 42 | 3 | 39 |
| 35-39 | 84 | 68 | 16 |
| 40-49 | 40 | 22 | 18 |
| 50-64 | 16 | 12 | 4 |
Online Student Enrollment
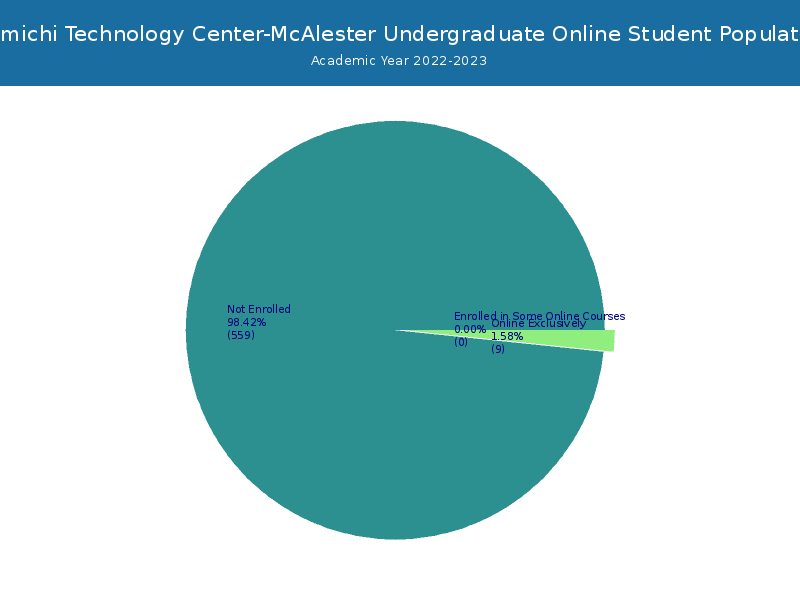
Distance learning, also called online education, is very attractive to students, especially who want to continue education and work in field. At Kiamichi Technology Center-McAlester, 9 students are enrolled exclusively in online courses and 0 students are enrolled in some online courses.
9 students lived in Oklahoma or jurisdiction in which the school is located are enrolled exclusively in online courses and - students live in other State or outside of the United States.
| All Students | Enrolled Exclusively Online Courses | Enrolled in Some Online Courses | |
|---|---|---|---|
| All Students | 568 | 9 | 0 |
| Undergraduate | 568 | 9 | 0 |
| Oklahoma Residents | Other States in U.S. | Outside of U.S. | |
|---|---|---|---|
| All Students | 9 | - | 0 |
| Undergraduate | 9 | - | 0 |
| Graduate | - | - | - |