Student Population by Gender
Wisconsin Lutheran College has a total of 1,086 enrolled students for the academic year 2022-2023. 1,003 students have enrolled in undergraduate programs and 83 students joined graduate programs.
By gender, 483 male and 603 female students (the male-female ratio is 44:56) are attending the school. The gender distribution is based on the 2022-2023 data.
| Total | Undergraduate | Graduate | |
|---|---|---|---|
| Total | 1,086 | 1,003 | 83 |
| Men | 483 | 457 | 26 |
| Women | 603 | 546 | 57 |
Student Distribution by Race/Ethnicity
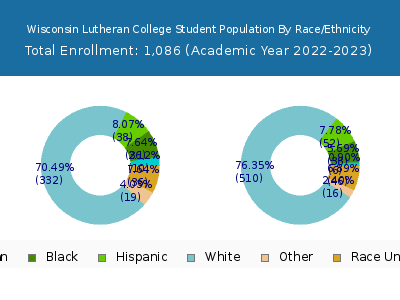
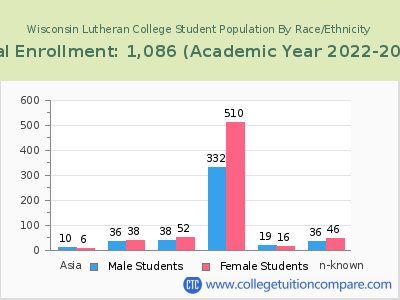
| Race | Total | Men | Women |
|---|---|---|---|
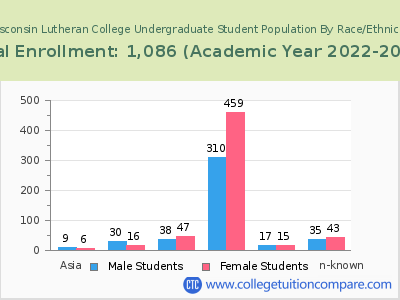
| American Indian or Native American | 1 | 1 | 0 |
| Asian | 15 | 8 | 7 |
| Black | 75 | 43 | 32 |
| Hispanic | 96 | 47 | 49 |
| Native Hawaiian or Other Pacific Islanders | 1 | 1 | 0 |
| White | 794 | 324 | 470 |
| Two or more races | 36 | 19 | 17 |
| Race Unknown | 59 | 36 | 23 |
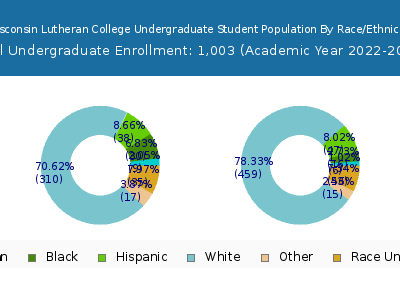
| Race | Total | Men | Women |
|---|---|---|---|
| American Indian or Native American | 1 | 1 | 0 |
| Asian | 14 | 7 | 7 |
| Black | 55 | 38 | 17 |
| Hispanic | 96 | 47 | 49 |
| Native Hawaiian or Other Pacific Islanders | 1 | 1 | 0 |
| White | 735 | 305 | 430 |
| Two or more races | 34 | 18 | 16 |
| Race Unknown | 58 | 36 | 22 |
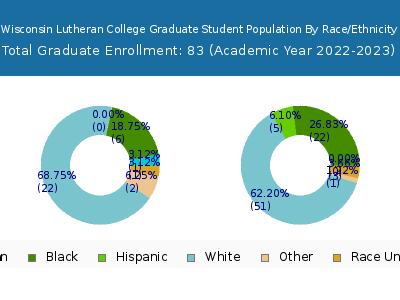
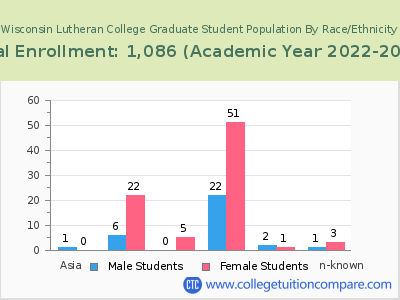
| Race | Total | Men | Women |
|---|---|---|---|
| American Indian or Native American | 0 | 0 | 0 |
| Asian | 0 | 0 | 0 |
| Black | 1 | 1 | 0 |
| Hispanic | 2 | 2 | 0 |
| Native Hawaiian or Other Pacific Islanders | 0 | 0 | 0 |
| White | 21 | 12 | 9 |
| Two or more races | 1 | 0 | 1 |
| Race Unknown | 0 | 0 | 0 |
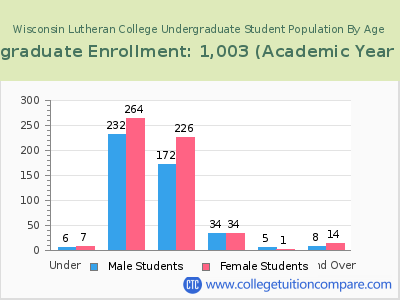
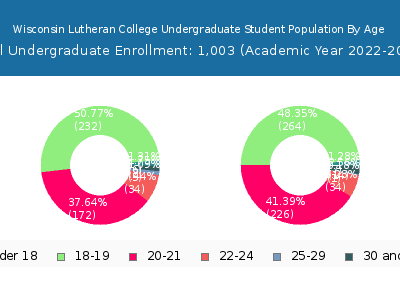
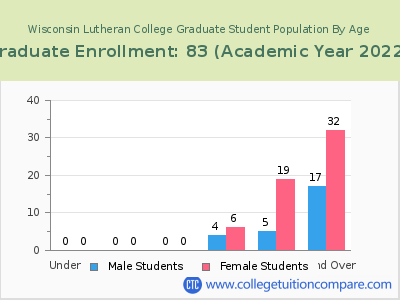
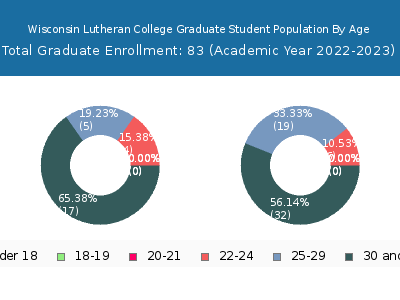
Student Age Distribution
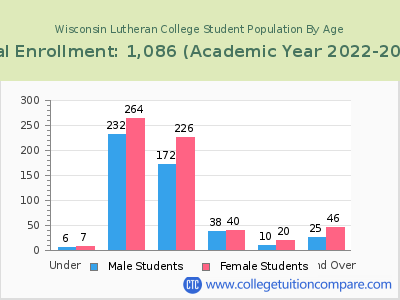
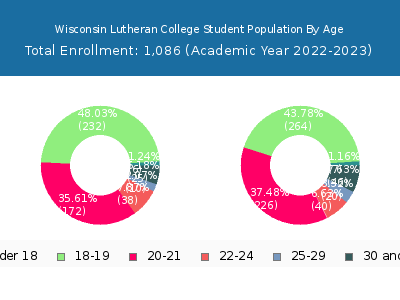
| Age | Total | Men | Women |
|---|---|---|---|
| Under 18 | 13 | 7 | 6 |
| 18-19 | 496 | 264 | 232 |
| 20-21 | 398 | 226 | 172 |
| 22-24 | 78 | 40 | 38 |
| 25-29 | 30 | 20 | 10 |
| 30-34 | 30 | 20 | 10 |
| 35-39 | 16 | 12 | 4 |
| 40-49 | 22 | 11 | 11 |
| 50-64 | 3 | 3 | 0 |
| Age | Total | Men | Women |
|---|---|---|---|
| Under 18 | 13 | 7 | 6 |
| 18-19 | 496 | 264 | 232 |
| 20-21 | 398 | 226 | 172 |
| 22-24 | 68 | 34 | 34 |
| 25-29 | 6 | 1 | 5 |
| 30-34 | 7 | 5 | 2 |
| 35-39 | 6 | 5 | 1 |
| 40-49 | 9 | 4 | 5 |
| Age | Total | Men | Women |
|---|
Online Student Enrollment
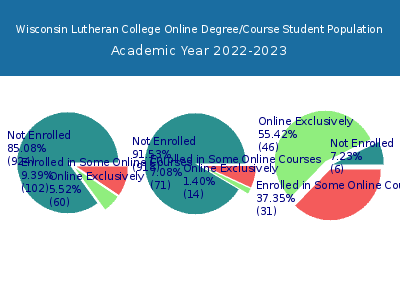
Distance learning, also called online education, is very attractive to students, especially who want to continue education and work in field. At Wisconsin Lutheran College, 60 students are enrolled exclusively in online courses and 102 students are enrolled in some online courses.
50 students lived in Wisconsin or jurisdiction in which the school is located are enrolled exclusively in online courses and 10 students live in other State or outside of the United States.
| All Students | Enrolled Exclusively Online Courses | Enrolled in Some Online Courses | |
|---|---|---|---|
| All Students | 1,086 | 60 | 102 |
| Undergraduate | 1,003 | 14 | 71 |
| Graduate | 83 | 46 | 31 |
| Wisconsin Residents | Other States in U.S. | Outside of U.S. | |
|---|---|---|---|
| All Students | 50 | 10 | 0 |
| Undergraduate | 12 | 2 | 0 |
| Graduate | 38 | 8 | 0 |
Transfer-in Students (Undergraduate)
Among 1,003 enrolled in undergraduate programs, 25 students have transferred-in from other institutions. The percentage of transfer-in students is 2.49%.
| Number of Students | |
|---|---|
| Regular Full-time | 939 |
| Transfer-in Full-time | 25 |
