Student Population by Gender
Lawrence University has a total of 1,426 enrolled students for the academic year 2022-2023. All 1,426 students are enrolled into undergraduate programs.
By gender, 658 male and 768 female students (the male-female ratio is 46:54) are attending the school. The gender distribution is based on the 2022-2023 data.
| Undergraduate | |
|---|---|
| Total | 1,426 |
| Men | 658 |
| Women | 768 |
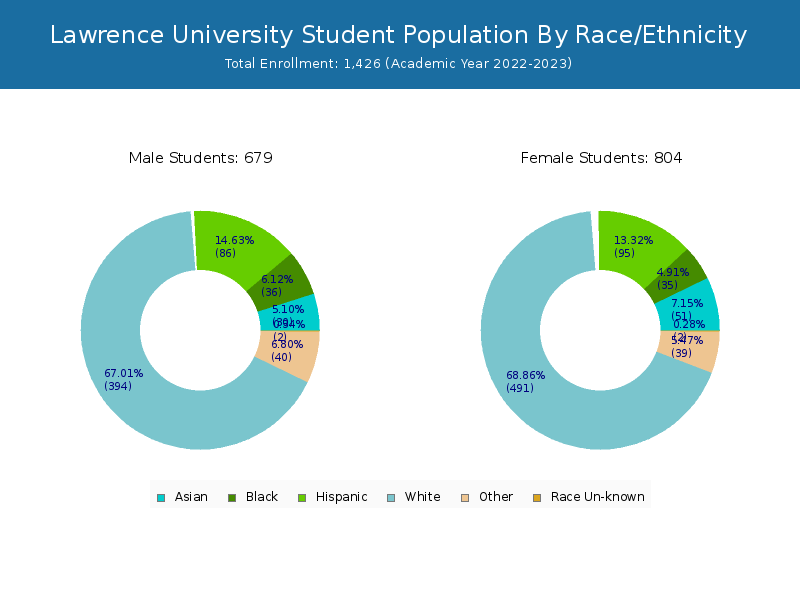
Student Distribution by Race/Ethnicity
By race/ethnicity, 859 White, 56 Black, and 78 Asian students out of a total of 1,426 are attending at Lawrence University. Comprehensive enrollment statistic data by race/ethnicity is shown in the next chart (Academic year 2022-2023 data).
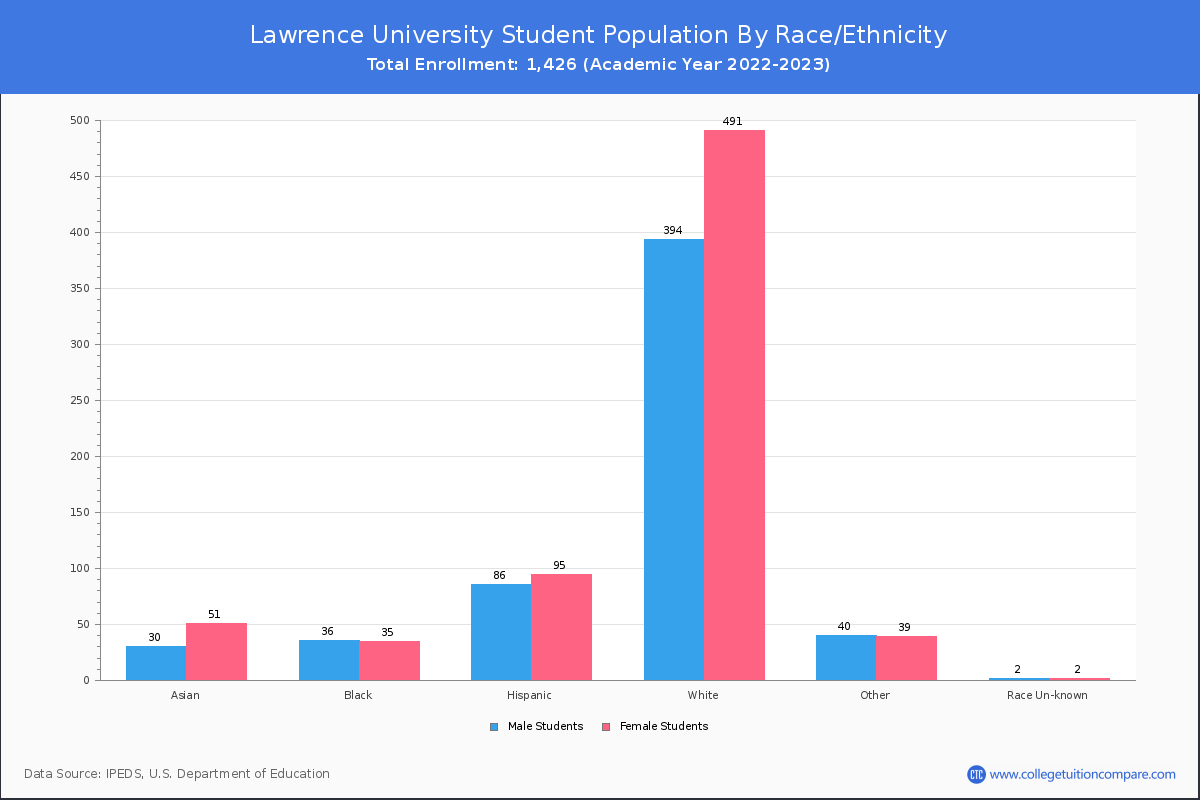
| Race | Total | Men | Women |
|---|---|---|---|
| American Indian or Native American | 6 | 5 | 1 |
| Asian | 78 | 31 | 47 |
| Black | 56 | 31 | 25 |
| Hispanic | 159 | 71 | 88 |
| Native Hawaiian or Other Pacific Islanders | 0 | 0 | 0 |
| White | 859 | 389 | 470 |
| Two or more races | 74 | 38 | 36 |
| Race Unknown | 18 | 5 | 13 |
Student Age Distribution
There are 1,416 students under 25 years old, and 10 students over 25 years old out of 1,426 total students.
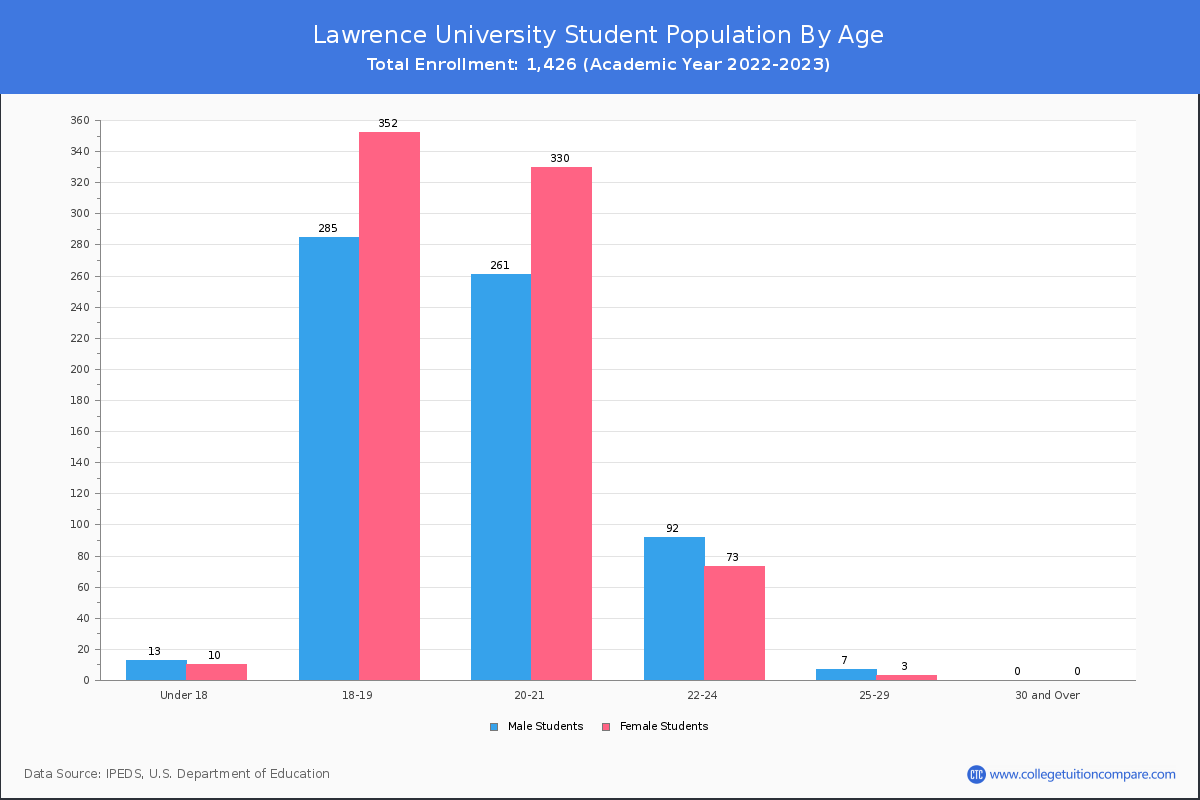
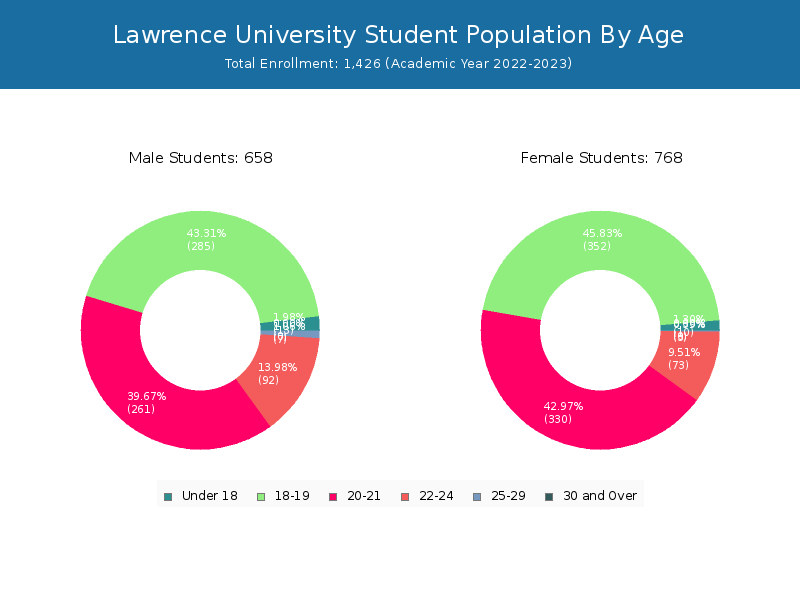
| Age | Total | Men | Women |
|---|---|---|---|
| Under 18 | 23 | 10 | 13 |
| 18-19 | 637 | 352 | 285 |
| 20-21 | 591 | 330 | 261 |
| 22-24 | 165 | 73 | 92 |
| 25-29 | 10 | 3 | 7 |
Transfer-in Students (Undergraduate)
Among 1,426 enrolled in undergraduate programs, 17 students have transferred-in from other institutions. The percentage of transfer-in students is 1.19%.
| Number of Students | |
|---|---|
| Regular Full-time | 1,388 |
| Transfer-in Full-time | 17 |