Student Population by Gender
Fairmont State University has a total of 3,498 enrolled students for the academic year 2022-2023. 3,197 students have enrolled in undergraduate programs and 301 students joined graduate programs.
By gender, 1,451 male and 2,047 female students (the male-female ratio is 41:59) are attending the school. The gender distribution is based on the 2022-2023 data.
| Total | Undergraduate | Graduate | |
|---|---|---|---|
| Total | 3,498 | 3,197 | 301 |
| Men | 1,451 | 1,350 | 101 |
| Women | 2,047 | 1,847 | 200 |
Student Distribution by Race/Ethnicity
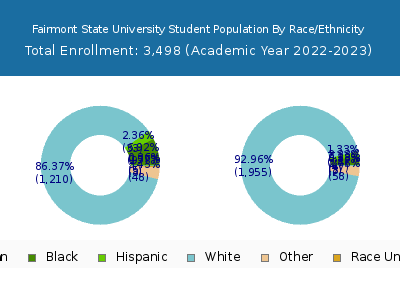
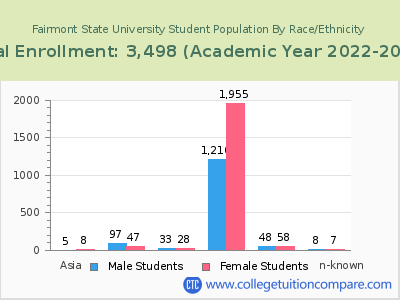
| Race | Total | Men | Women |
|---|---|---|---|
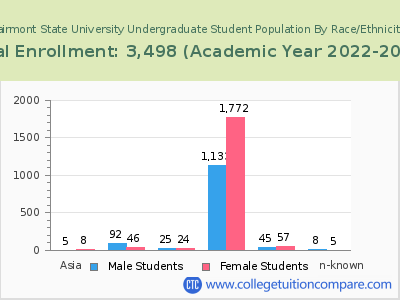
| American Indian or Native American | 21 | 15 | 6 |
| Asian | 34 | 15 | 19 |
| Black | 163 | 102 | 61 |
| Hispanic | 32 | 15 | 17 |
| Native Hawaiian or Other Pacific Islanders | 5 | 3 | 2 |
| White | 3,012 | 1,215 | 1,797 |
| Two or more races | 74 | 34 | 40 |
| Race Unknown | 157 | 52 | 105 |
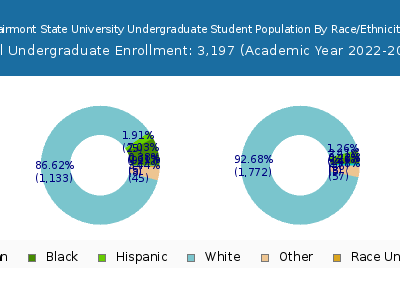
| Race | Total | Men | Women |
|---|---|---|---|
| American Indian or Native American | 19 | 14 | 5 |
| Asian | 31 | 13 | 18 |
| Black | 147 | 94 | 53 |
| Hispanic | 26 | 11 | 15 |
| Native Hawaiian or Other Pacific Islanders | 5 | 3 | 2 |
| White | 2,757 | 1,136 | 1,621 |
| Two or more races | 73 | 34 | 39 |
| Race Unknown | 139 | 45 | 94 |
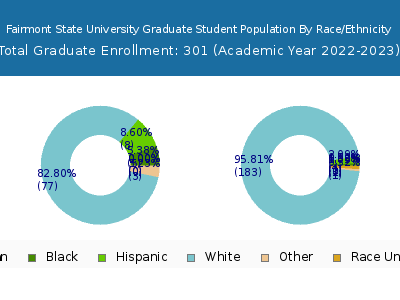
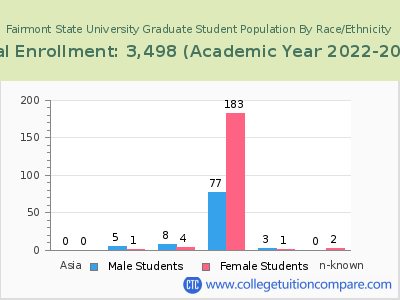
| Race | Total | Men | Women |
|---|---|---|---|
| American Indian or Native American | 3 | 2 | 1 |
| Asian | 2 | 1 | 1 |
| Black | 11 | 4 | 7 |
| Hispanic | 2 | 2 | 0 |
| Native Hawaiian or Other Pacific Islanders | 1 | 0 | 1 |
| White | 146 | 55 | 91 |
| Two or more races | 12 | 7 | 5 |
| Race Unknown | 11 | 5 | 6 |
Student Age Distribution
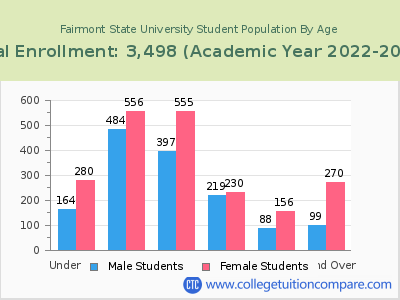
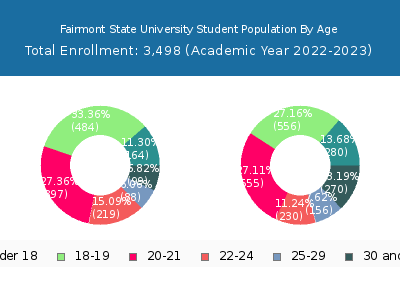
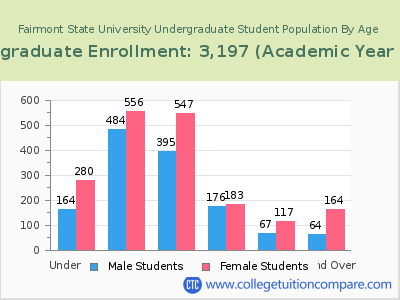
By age, Fairmont State has 444 students under 18 years old and 1 students over 65 years old. There are 2,885 students under 25 years old, and 613 students over 25 years old out of 3,498 total students.
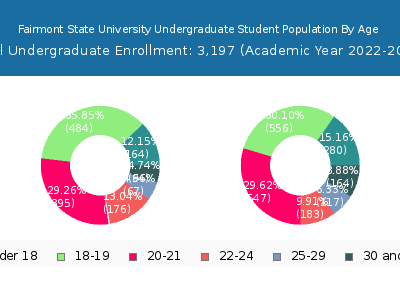
In undergraduate programs, 444 students are younger than 18 and 1 students are older than 65. Fairmont State has 2,785 undergraduate students aged under 25 and 412 students aged 25 and over.
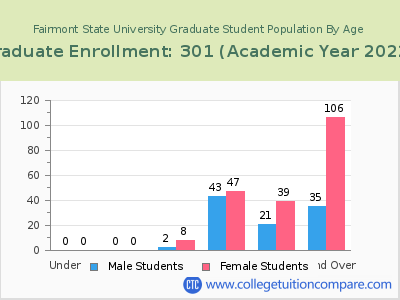
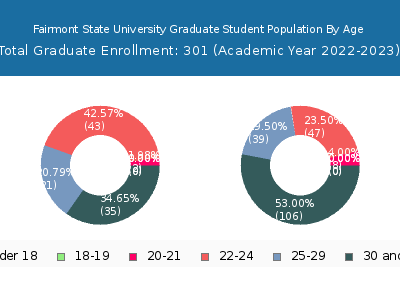
It has 100 graduate students aged under 25 and 201 students aged 25 and over.
| Age | Total | Men | Women |
|---|---|---|---|
| Under 18 | 444 | 280 | 164 |
| 18-19 | 1,040 | 556 | 484 |
| 20-21 | 952 | 555 | 397 |
| 22-24 | 449 | 230 | 219 |
| 25-29 | 244 | 156 | 88 |
| 30-34 | 114 | 82 | 32 |
| 35-39 | 72 | 49 | 23 |
| 40-49 | 136 | 106 | 30 |
| 50-64 | 46 | 32 | 14 |
| Over 65 | 1 | 1 | 0 |
| Age | Total | Men | Women |
|---|---|---|---|
| Under 18 | 444 | 280 | 164 |
| 18-19 | 1,040 | 556 | 484 |
| 20-21 | 942 | 547 | 395 |
| 22-24 | 359 | 183 | 176 |
| 25-29 | 184 | 117 | 67 |
| 30-34 | 78 | 57 | 21 |
| 35-39 | 47 | 30 | 17 |
| 40-49 | 71 | 53 | 18 |
| 50-64 | 31 | 23 | 8 |
| Over 65 | 1 | 1 | 0 |
| Age | Total | Men | Women |
|---|
Online Student Enrollment
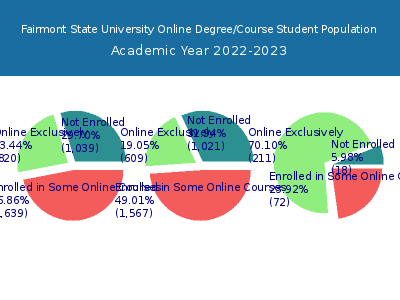
Distance learning, also called online education, is very attractive to students, especially who want to continue education and work in field. At Fairmont State University, 820 students are enrolled exclusively in online courses and 1,639 students are enrolled in some online courses.
770 students lived in West Virginia or jurisdiction in which the school is located are enrolled exclusively in online courses and 50 students live in other State or outside of the United States.
| All Students | Enrolled Exclusively Online Courses | Enrolled in Some Online Courses | |
|---|---|---|---|
| All Students | 3,498 | 820 | 1,639 |
| Undergraduate | 3,197 | 609 | 1,567 |
| Graduate | 301 | 211 | 72 |
| West Virginia Residents | Other States in U.S. | Outside of U.S. | |
|---|---|---|---|
| All Students | 770 | 50 | 0 |
| Undergraduate | 579 | 30 | 0 |
| Graduate | 191 | 20 | 0 |
Transfer-in Students (Undergraduate)
Among 3,197 enrolled in undergraduate programs, 188 students have transferred-in from other institutions. The percentage of transfer-in students is 5.88%.139 students have transferred in as full-time status and 49 students transferred in as part-time status.
| Number of Students | |
|---|---|
| Regular Full-time | 2,216 |
| Transfer-in Full-time | 139 |
| Regular Part-time | 793 |
| Transfer-in Part-time | 49 |
