Student Population by Gender
Whitworth University has a total of 2,415 enrolled students for the academic year 2022-2023. 2,047 students have enrolled in undergraduate programs and 368 students joined graduate programs.
By gender, 986 male and 1,429 female students (the male-female ratio is 41:59) are attending the school. The gender distribution is based on the 2022-2023 data.
| Total | Undergraduate | Graduate | |
|---|---|---|---|
| Total | 2,415 | 2,047 | 368 |
| Men | 986 | 862 | 124 |
| Women | 1,429 | 1,185 | 244 |
Student Distribution by Race/Ethnicity
| Race | Total | Men | Women |
|---|---|---|---|
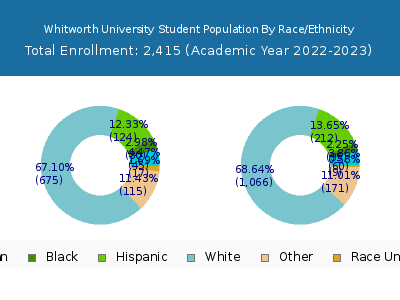
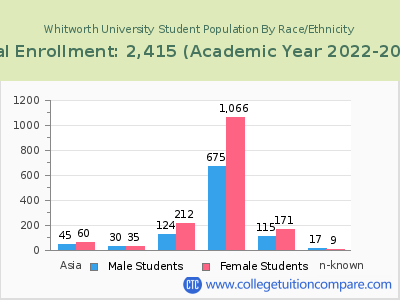
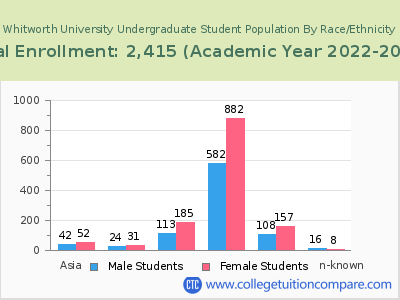
| American Indian or Native American | 11 | 3 | 8 |
| Asian | 96 | 38 | 58 |
| Black | 68 | 31 | 37 |
| Hispanic | 302 | 109 | 193 |
| Native Hawaiian or Other Pacific Islanders | 40 | 14 | 26 |
| White | 1,534 | 618 | 916 |
| Two or more races | 219 | 91 | 128 |
| Race Unknown | 19 | 15 | 4 |
| Race | Total | Men | Women |
|---|---|---|---|
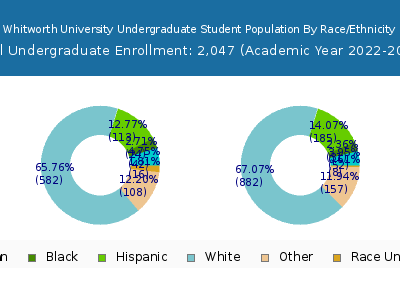
| American Indian or Native American | 8 | 2 | 6 |
| Asian | 85 | 36 | 49 |
| Black | 54 | 25 | 29 |
| Hispanic | 263 | 91 | 172 |
| Native Hawaiian or Other Pacific Islanders | 38 | 13 | 25 |
| White | 1,275 | 533 | 742 |
| Two or more races | 194 | 85 | 109 |
| Race Unknown | 13 | 11 | 2 |
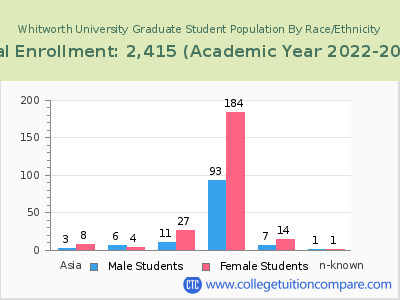
| Race | Total | Men | Women |
|---|---|---|---|
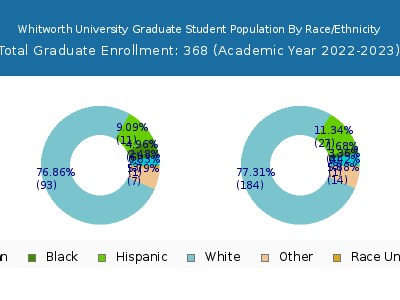
| American Indian or Native American | 0 | 0 | 0 |
| Asian | 0 | 0 | 0 |
| Black | 3 | 1 | 2 |
| Hispanic | 7 | 2 | 5 |
| Native Hawaiian or Other Pacific Islanders | 1 | 1 | 0 |
| White | 45 | 20 | 25 |
| Two or more races | 5 | 1 | 4 |
| Race Unknown | 0 | 0 | 0 |
Student Age Distribution
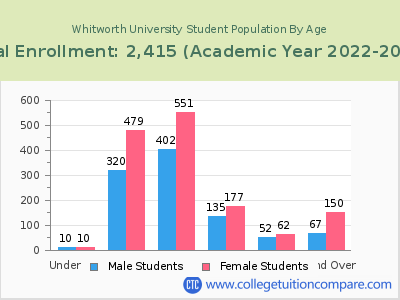
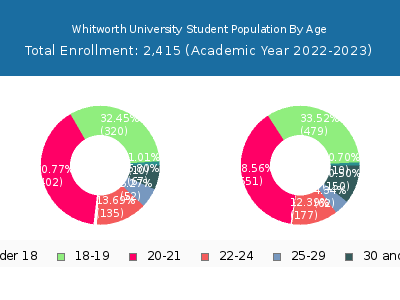
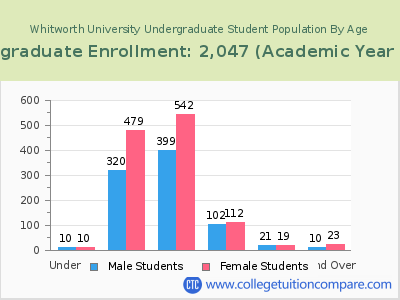
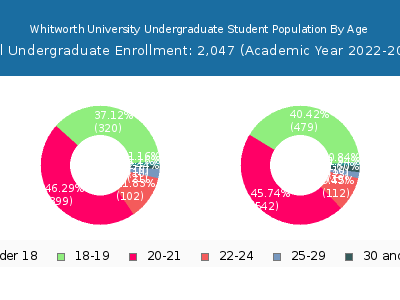
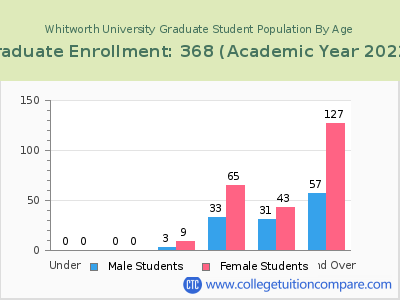
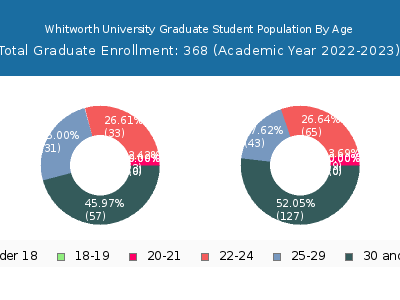
By age, Whitworth has 20 students under 18 years old and 2 students over 65 years old. There are 2,084 students under 25 years old, and 331 students over 25 years old out of 2,415 total students.
Whitworth has 1,974 undergraduate students aged under 25 and 73 students aged 25 and over.
It has 110 graduate students aged under 25 and 258 students aged 25 and over.
| Age | Total | Men | Women |
|---|---|---|---|
| Under 18 | 20 | 10 | 10 |
| 18-19 | 799 | 479 | 320 |
| 20-21 | 953 | 551 | 402 |
| 22-24 | 312 | 177 | 135 |
| 25-29 | 114 | 62 | 52 |
| 30-34 | 73 | 48 | 25 |
| 35-39 | 49 | 40 | 9 |
| 40-49 | 68 | 45 | 23 |
| 50-64 | 25 | 16 | 9 |
| Over 65 | 2 | 1 | 1 |
| Age | Total | Men | Women |
|---|---|---|---|
| Under 18 | 20 | 10 | 10 |
| 18-19 | 799 | 479 | 320 |
| 20-21 | 941 | 542 | 399 |
| 22-24 | 214 | 112 | 102 |
| 25-29 | 40 | 19 | 21 |
| 30-34 | 14 | 9 | 5 |
| 35-39 | 8 | 7 | 1 |
| 40-49 | 9 | 6 | 3 |
| 50-64 | 2 | 1 | 1 |
| Age | Total | Men | Women |
|---|
Online Student Enrollment
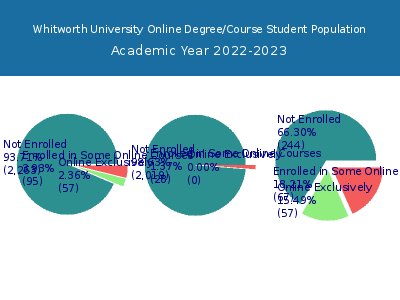
Distance learning, also called online education, is very attractive to students, especially who want to continue education and work in field. At Whitworth University, 57 students are enrolled exclusively in online courses and 95 students are enrolled in some online courses.
30 students lived in Washington or jurisdiction in which the school is located are enrolled exclusively in online courses and 27 students live in other State or outside of the United States.
| All Students | Enrolled Exclusively Online Courses | Enrolled in Some Online Courses | |
|---|---|---|---|
| All Students | 2,415 | 57 | 95 |
| Undergraduate | 2,047 | 0 | 28 |
| Graduate | 368 | 57 | 67 |
| Washington Residents | Other States in U.S. | Outside of U.S. | |
|---|---|---|---|
| All Students | 30 | 25 | 2 |
| Undergraduate | 0 | - | 0 |
| Graduate | 30 | 25 | 2 |
Transfer-in Students (Undergraduate)
Among 2,047 enrolled in undergraduate programs, 64 students have transferred-in from other institutions. The percentage of transfer-in students is 3.13%.
| Number of Students | |
|---|---|
| Regular Full-time | 1,933 |
| Transfer-in Full-time | 64 |
