Student Population by Gender
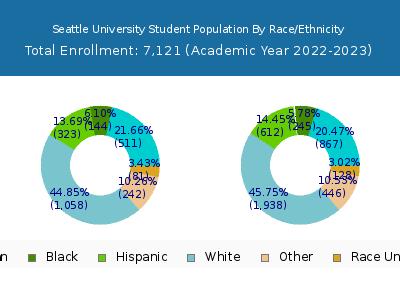
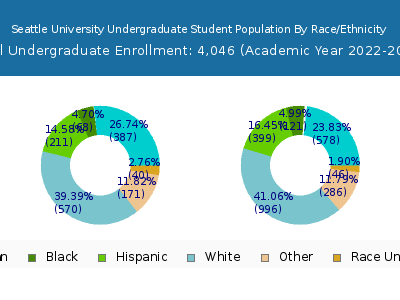
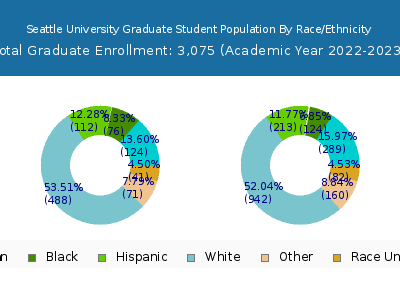
Seattle University has a total of 7,121 enrolled students for the academic year 2022-2023. 4,046 students have enrolled in undergraduate programs and 3,075 students joined graduate programs.
By gender, 2,617 male and 4,504 female students (the male-female ratio is 37:63) are attending the school. The gender distribution is based on the 2022-2023 data.
| Total | Undergraduate | Graduate | |
|---|---|---|---|
| Total | 7,121 | 4,046 | 3,075 |
| Men | 2,617 | 1,588 | 1,029 |
| Women | 4,504 | 2,458 | 2,046 |
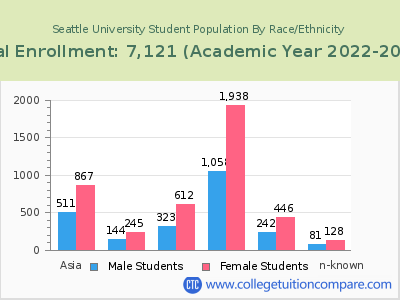
Student Distribution by Race/Ethnicity
| Race | Total | Men | Women |
|---|---|---|---|
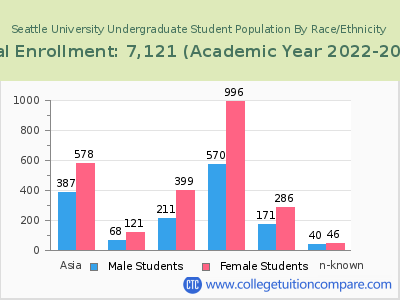
| American Indian or Native American | 19 | 5 | 14 |
| Asian | 1,450 | 555 | 895 |
| Black | 397 | 160 | 237 |
| Hispanic | 919 | 308 | 611 |
| Native Hawaiian or Other Pacific Islanders | 52 | 14 | 38 |
| White | 2,750 | 934 | 1,816 |
| Two or more races | 580 | 219 | 361 |
| Race Unknown | 141 | 55 | 86 |
| Race | Total | Men | Women |
|---|---|---|---|
| American Indian or Native American | 6 | 2 | 4 |
| Asian | 1,027 | 421 | 606 |
| Black | 215 | 83 | 132 |
| Hispanic | 590 | 199 | 391 |
| Native Hawaiian or Other Pacific Islanders | 43 | 11 | 32 |
| White | 1,372 | 493 | 879 |
| Two or more races | 384 | 161 | 223 |
| Race Unknown | 57 | 29 | 28 |
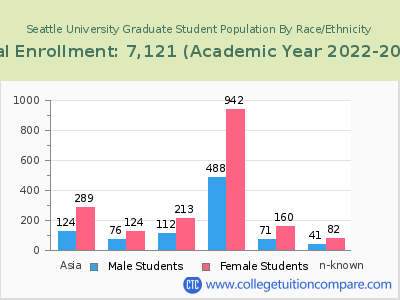
| Race | Total | Men | Women |
|---|---|---|---|
| American Indian or Native American | 1 | 0 | 1 |
| Asian | 63 | 19 | 44 |
| Black | 28 | 7 | 21 |
| Hispanic | 42 | 19 | 23 |
| Native Hawaiian or Other Pacific Islanders | 1 | 1 | 0 |
| White | 81 | 37 | 44 |
| Two or more races | 30 | 14 | 16 |
| Race Unknown | 1 | 0 | 1 |
Student Age Distribution
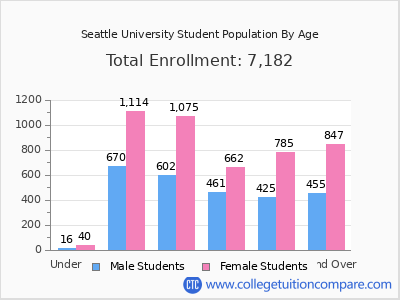
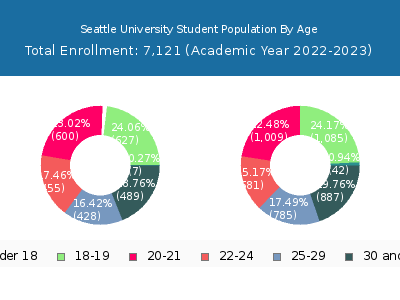
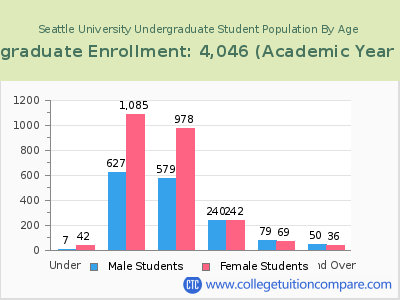
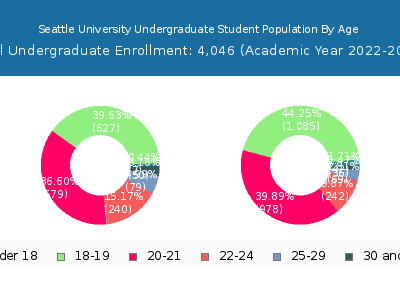
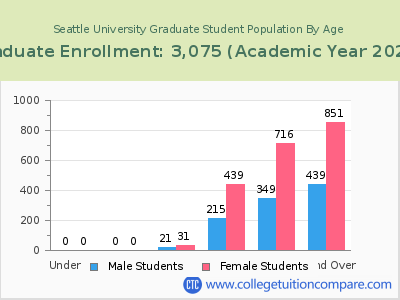
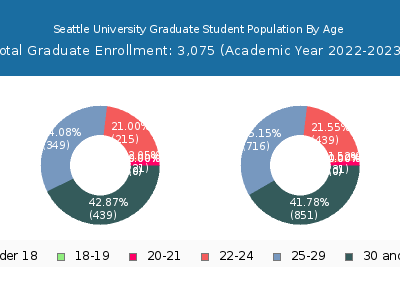
By age, Seattle has 49 students under 18 years old and 3 students over 65 years old. There are 4,506 students under 25 years old, and 2,589 students over 25 years old out of 7,121 total students.
Seattle has 3,800 undergraduate students aged under 25 and 234 students aged 25 and over.
It has 706 graduate students aged under 25 and 2,355 students aged 25 and over.
| Age | Total | Men | Women |
|---|---|---|---|
| Under 18 | 49 | 42 | 7 |
| 18-19 | 1,712 | 1,085 | 627 |
| 20-21 | 1,609 | 1,009 | 600 |
| 22-24 | 1,136 | 681 | 455 |
| 25-29 | 1,213 | 785 | 428 |
| 30-34 | 618 | 390 | 228 |
| 35-39 | 332 | 211 | 121 |
| 40-49 | 309 | 199 | 110 |
| 50-64 | 114 | 85 | 29 |
| Over 65 | 3 | 2 | 1 |
| Age | Total | Men | Women |
|---|---|---|---|
| Under 18 | 49 | 42 | 7 |
| 18-19 | 1,712 | 1,085 | 627 |
| 20-21 | 1,557 | 978 | 579 |
| 22-24 | 482 | 242 | 240 |
| 25-29 | 148 | 69 | 79 |
| 30-34 | 43 | 14 | 29 |
| 35-39 | 26 | 15 | 11 |
| 40-49 | 14 | 5 | 9 |
| 50-64 | 3 | 2 | 1 |
| Age | Total | Men | Women |
|---|
Online Student Enrollment
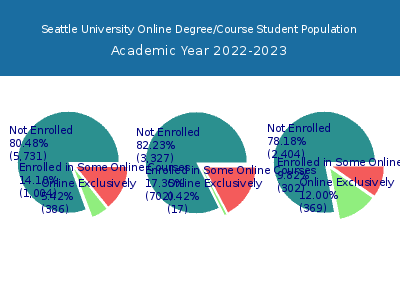
Distance learning, also called online education, is very attractive to students, especially who want to continue education and work in field. At Seattle University, 386 students are enrolled exclusively in online courses and 1,004 students are enrolled in some online courses.
336 students lived in Washington or jurisdiction in which the school is located are enrolled exclusively in online courses and 50 students live in other State or outside of the United States.
| All Students | Enrolled Exclusively Online Courses | Enrolled in Some Online Courses | |
|---|---|---|---|
| All Students | 7,121 | 386 | 1,004 |
| Undergraduate | 4,046 | 17 | 702 |
| Graduate | 3,075 | 369 | 302 |
| Washington Residents | Other States in U.S. | Outside of U.S. | |
|---|---|---|---|
| All Students | 336 | 48 | 2 |
| Undergraduate | 11 | 6 | 0 |
| Graduate | 325 | 42 | 2 |
Transfer-in Students (Undergraduate)
Among 4,046 enrolled in undergraduate programs, 302 students have transferred-in from other institutions. The percentage of transfer-in students is 7.46%.293 students have transferred in as full-time status and 9 students transferred in as part-time status.
| Number of Students | |
|---|---|
| Regular Full-time | 3,581 |
| Transfer-in Full-time | 293 |
| Regular Part-time | 163 |
| Transfer-in Part-time | 9 |
