Student Population by Gender
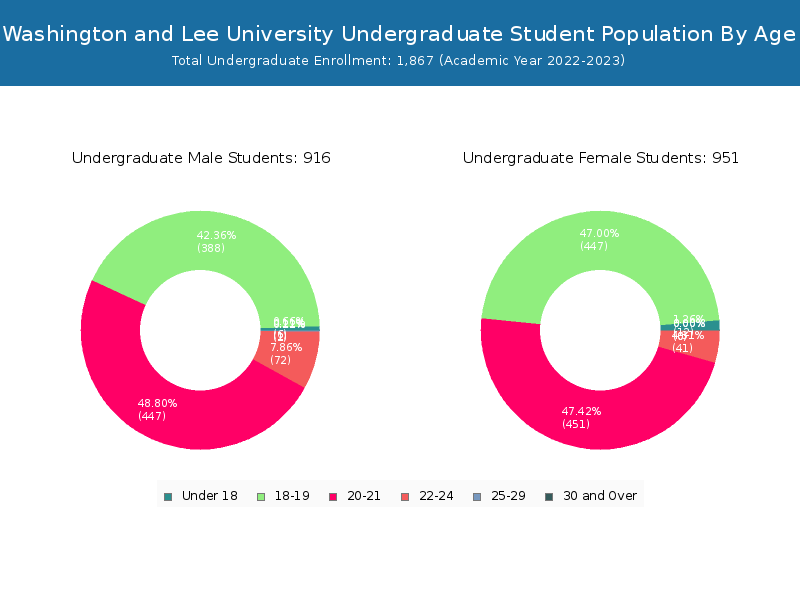
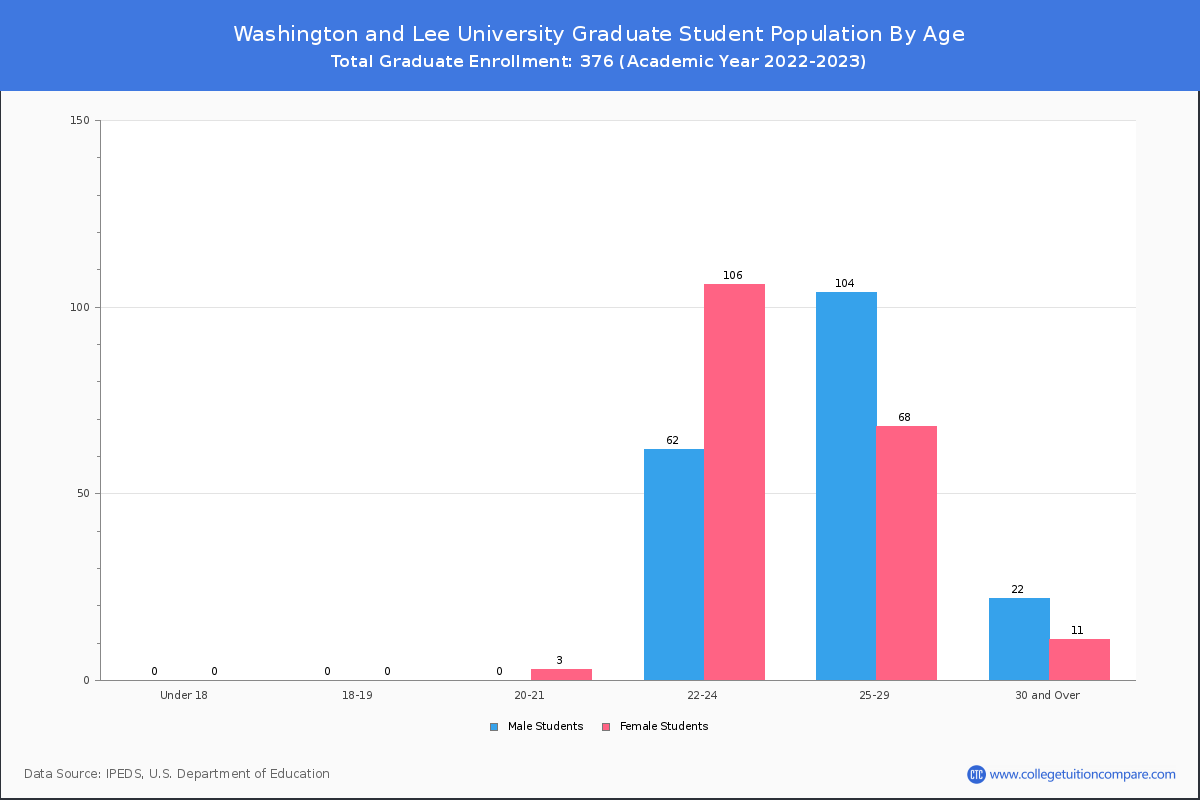
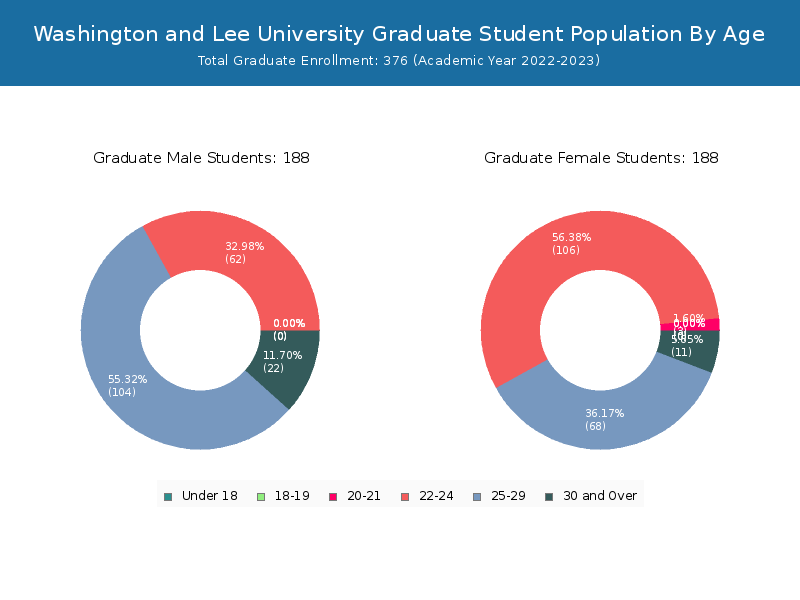
Washington and Lee University has a total of 2,243 enrolled students for the academic year 2022-2023. 1,867 students have enrolled in undergraduate programs and 376 students joined graduate programs.
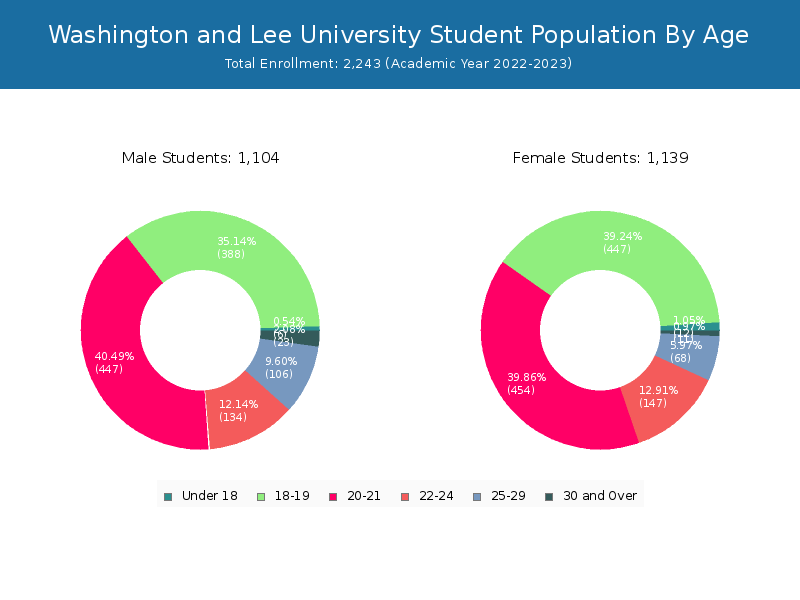
By gender, 1,104 male and 1,139 female students (the male-female ratio is 49:51) are attending the school. The gender distribution is based on the 2022-2023 data.
| Total | Undergraduate | Graduate | |
|---|---|---|---|
| Total | 2,243 | 1,867 | 376 |
| Men | 1,104 | 916 | 188 |
| Women | 1,139 | 951 | 188 |
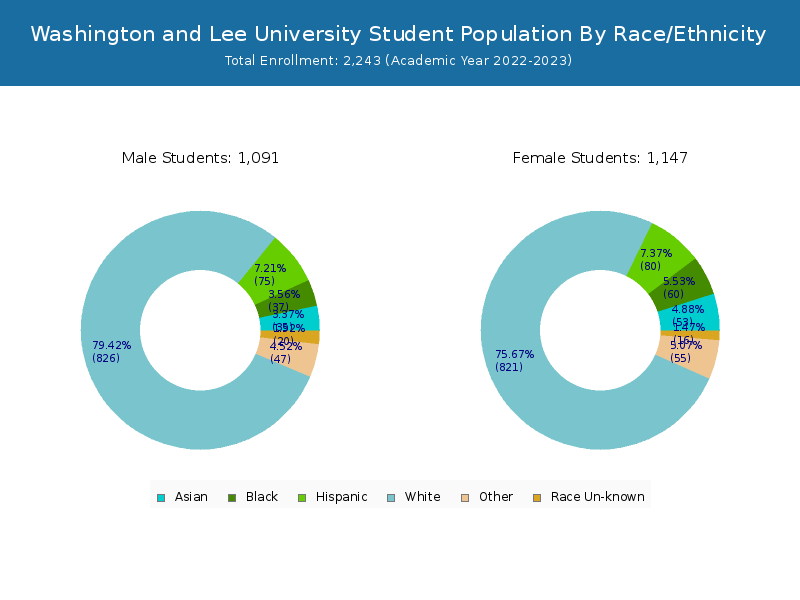
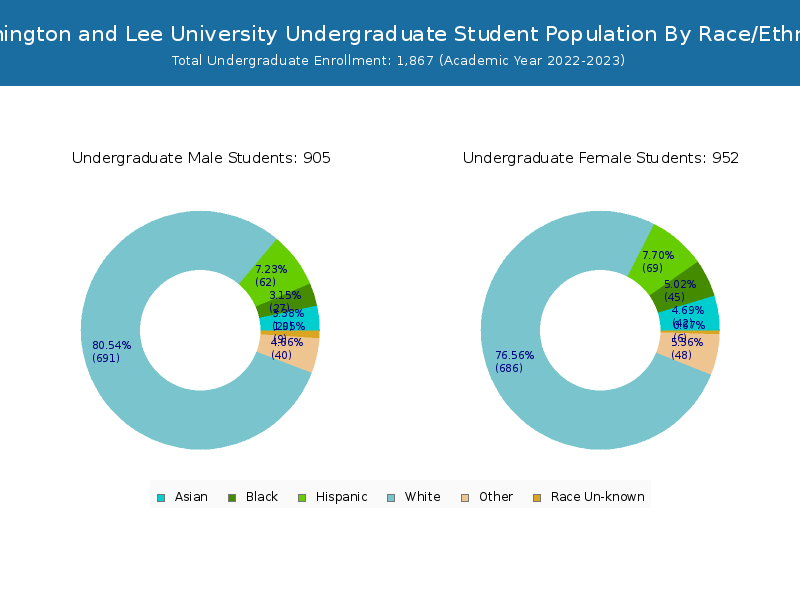
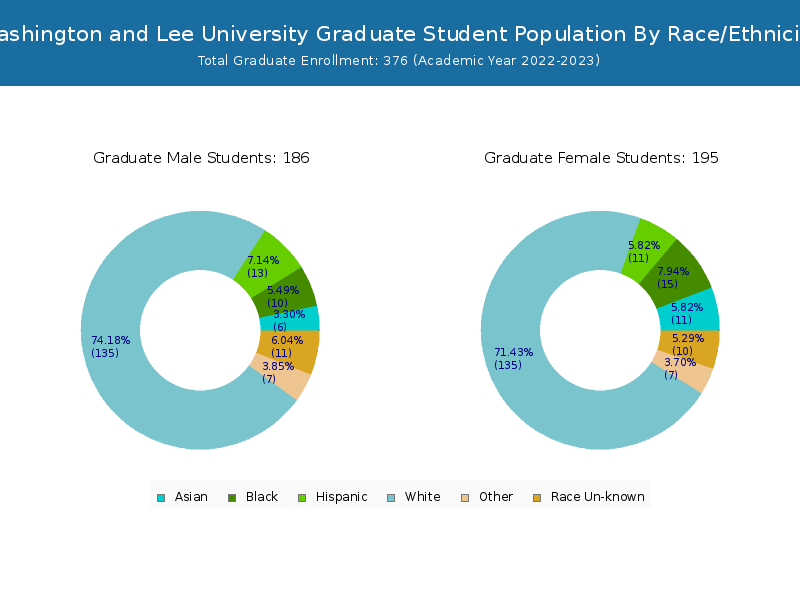
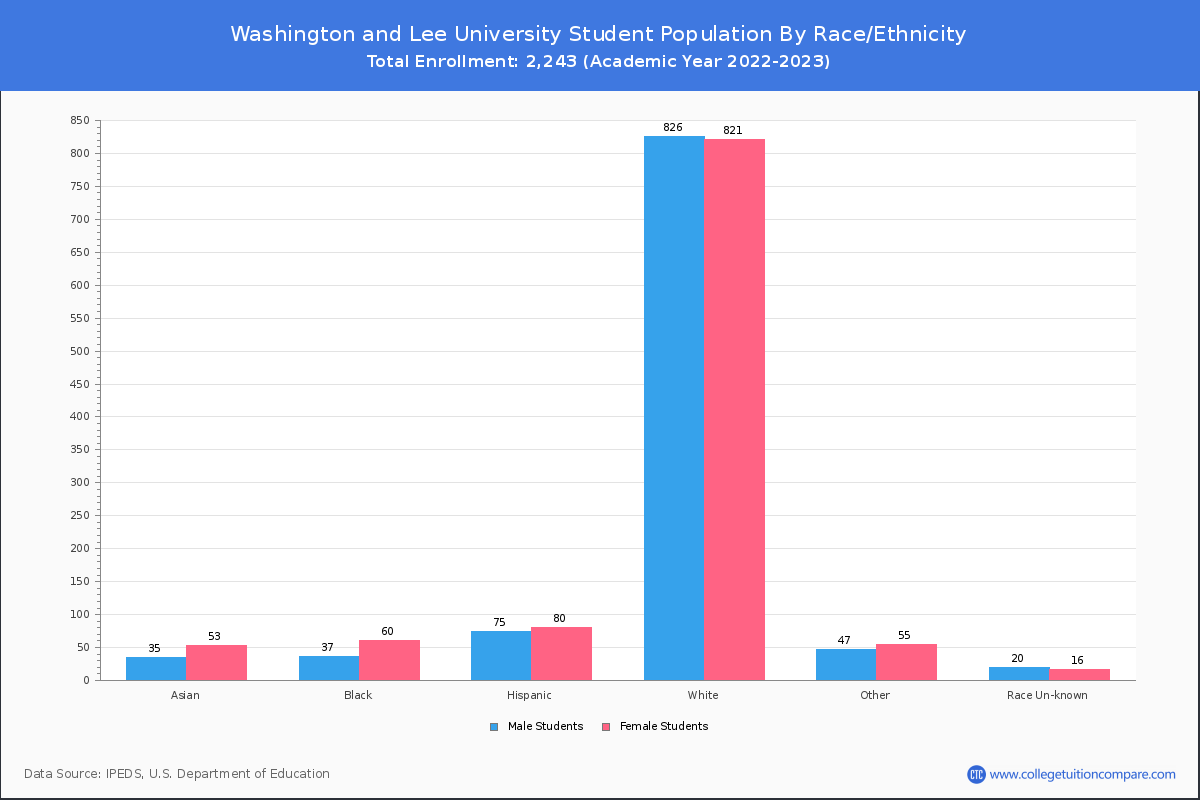
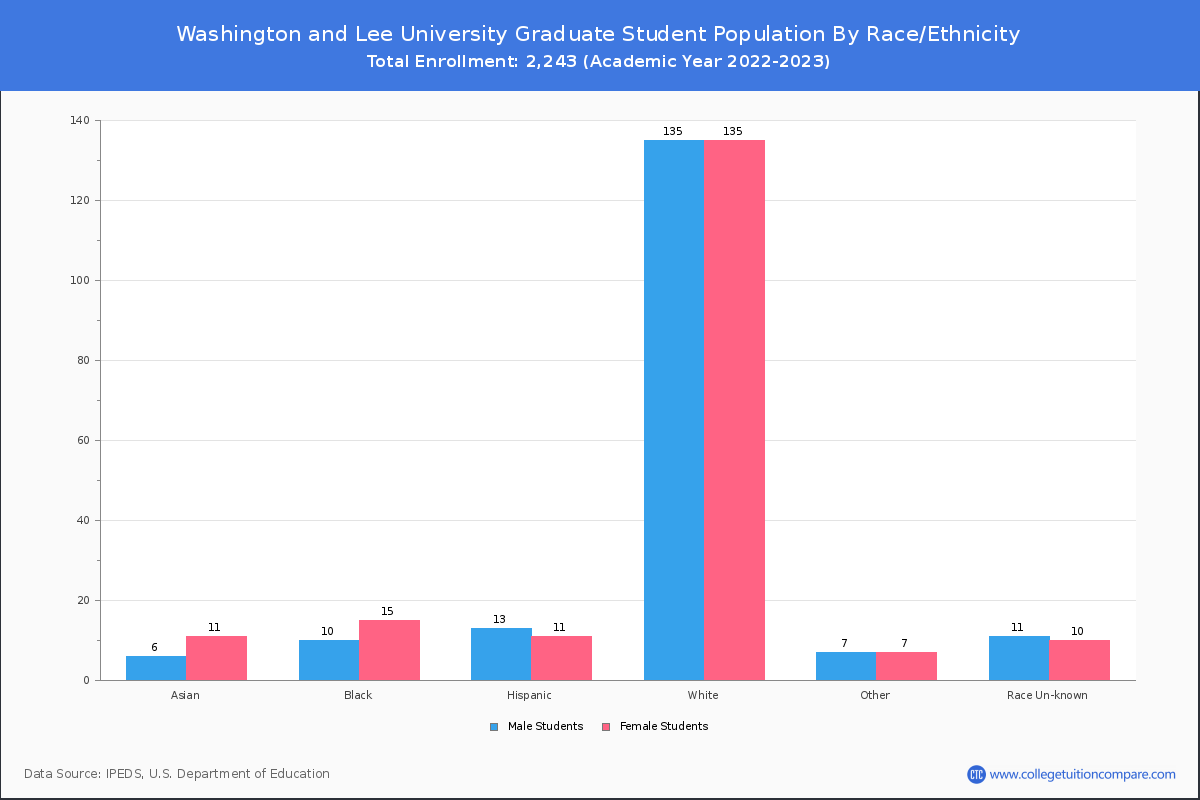
Student Distribution by Race/Ethnicity
By race/ethnicity, 1,603 White, 96 Black, and 96 Asian students out of a total of 2,243 are attending at Washington and Lee University. Comprehensive enrollment statistic data by race/ethnicity is shown in the next chart (Academic year 2022-2023 data).
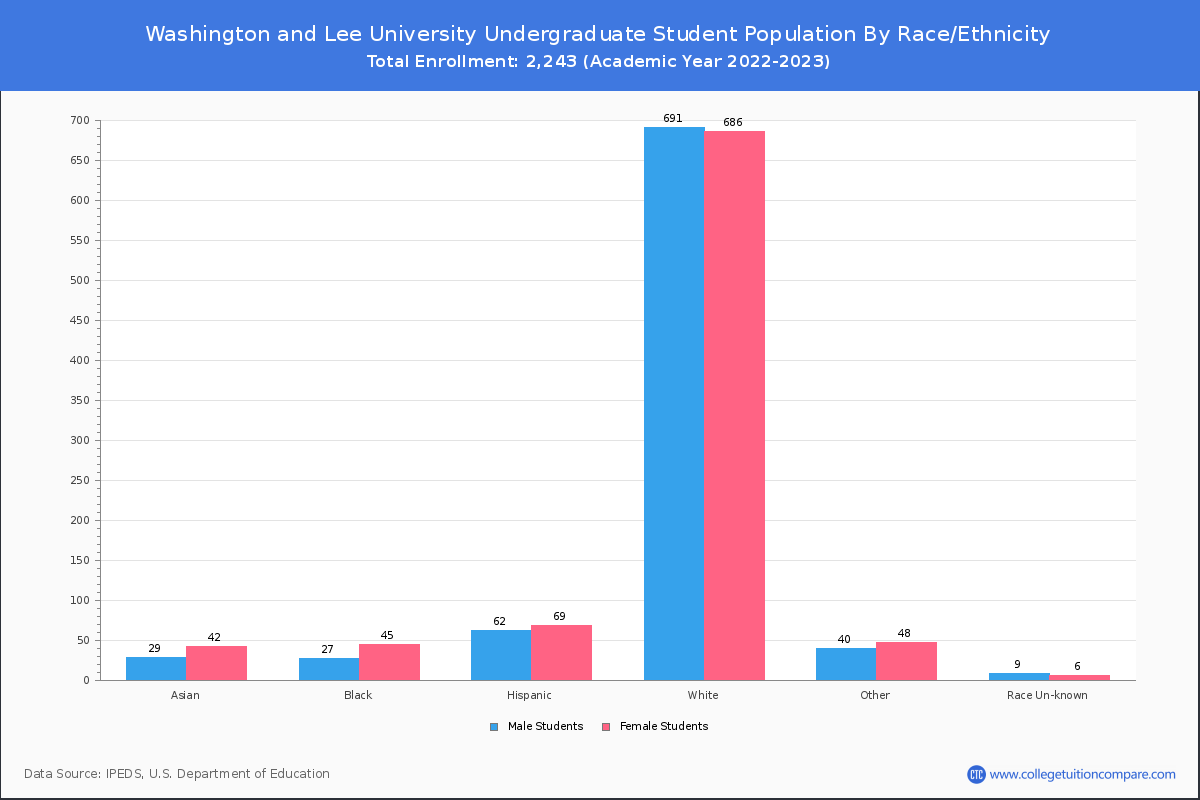
| Race | Total | Men | Women |
|---|---|---|---|
| American Indian or Native American | 3 | 2 | 1 |
| Asian | 96 | 38 | 58 |
| Black | 96 | 43 | 53 |
| Hispanic | 175 | 86 | 89 |
| Native Hawaiian or Other Pacific Islanders | 3 | 1 | 2 |
| White | 1,603 | 803 | 800 |
| Two or more races | 93 | 46 | 47 |
| Race Unknown | 46 | 25 | 21 |
| Race | Total | Men | Women |
|---|---|---|---|
| American Indian or Native American | 2 | 1 | 1 |
| Asian | 74 | 31 | 43 |
| Black | 74 | 36 | 38 |
| Hispanic | 149 | 71 | 78 |
| Native Hawaiian or Other Pacific Islanders | 2 | 1 | 1 |
| White | 1,347 | 666 | 681 |
| Two or more races | 86 | 43 | 43 |
| Race Unknown | 12 | 9 | 3 |
| Race | Total | Men | Women |
|---|---|---|---|
| American Indian or Native American | 0 | 0 | 0 |
| Asian | 0 | 0 | 0 |
| Black | 0 | 0 | 0 |
| Hispanic | 0 | 0 | 0 |
| Native Hawaiian or Other Pacific Islanders | 0 | 0 | 0 |
| White | 1 | 0 | 1 |
| Two or more races | 0 | 0 | 0 |
| Race Unknown | 0 | 0 | 0 |
Student Age Distribution
There are 2,035 students under 25 years old, and 208 students over 25 years old out of 2,243 total students.
W&L has 1,864 undergraduate students aged under 25 and 3 students aged 25 and over.
It has 171 graduate students aged under 25 and 205 students aged 25 and over.
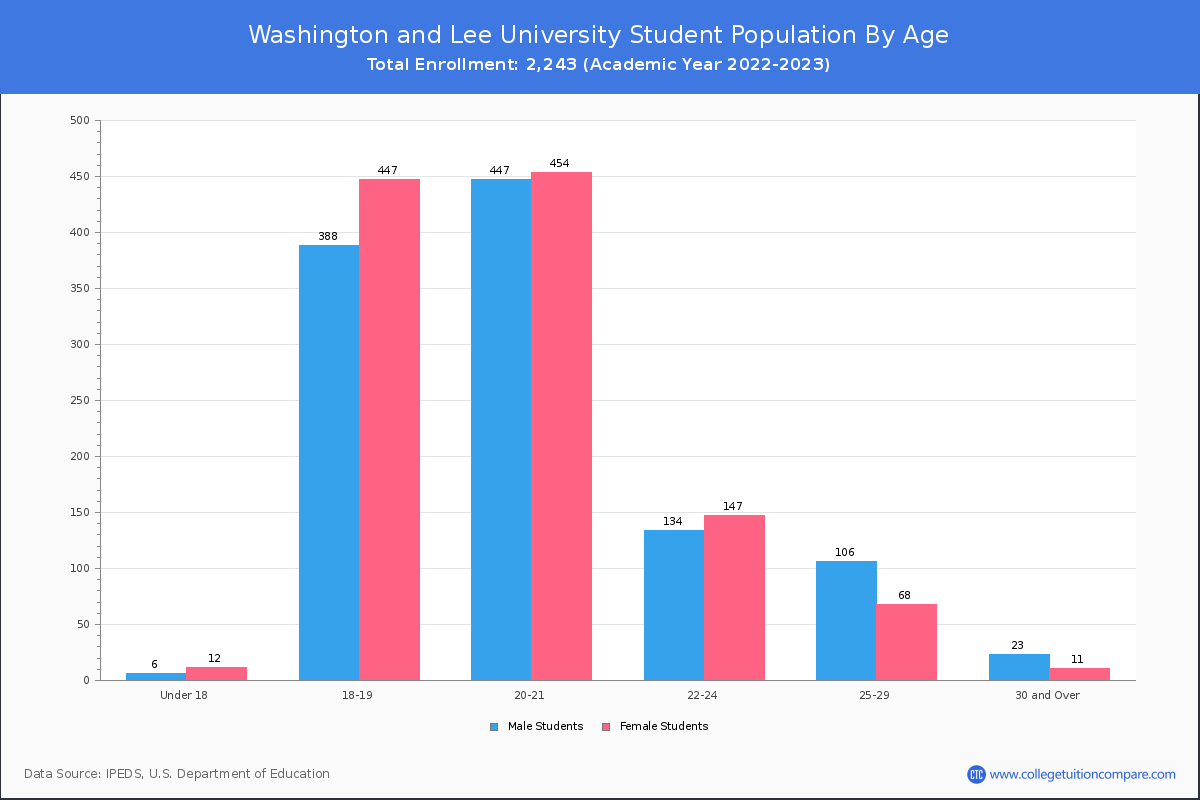
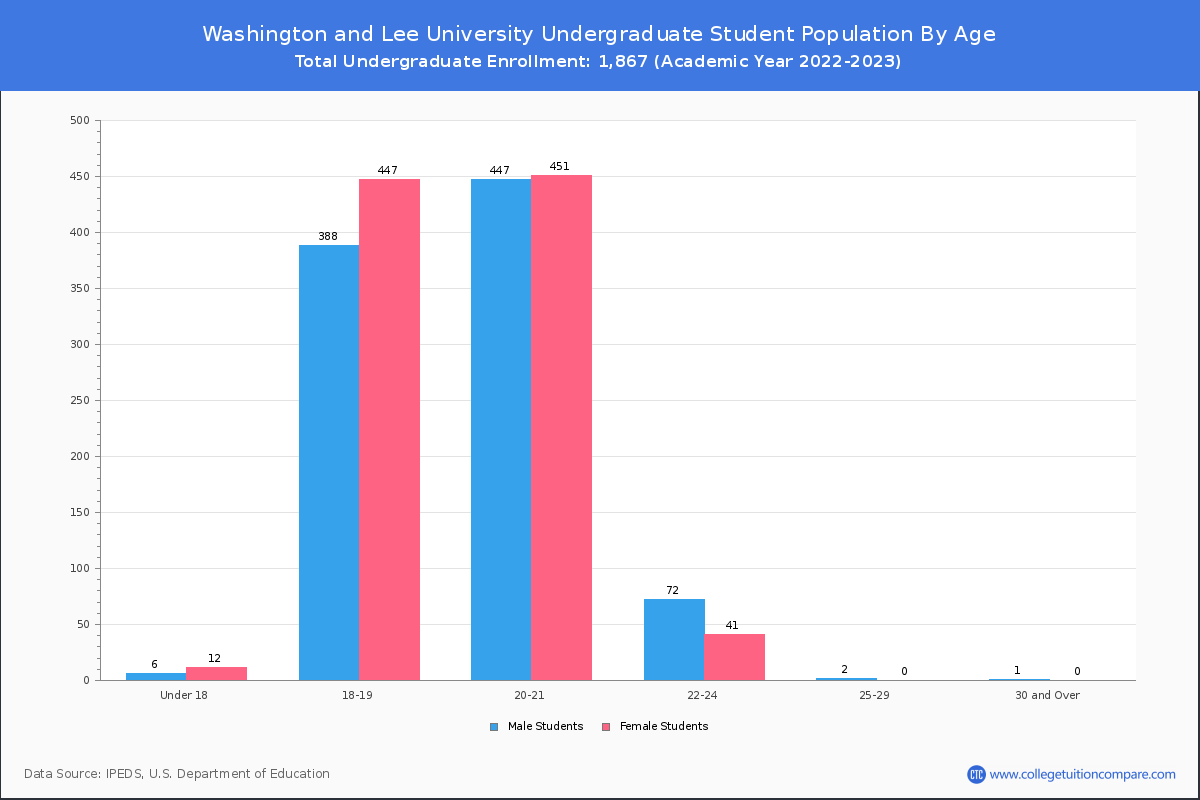
| Age | Total | Men | Women |
|---|---|---|---|
| Under 18 | 18 | 12 | 6 |
| 18-19 | 835 | 447 | 388 |
| 20-21 | 901 | 454 | 447 |
| 22-24 | 281 | 147 | 134 |
| 25-29 | 174 | 68 | 106 |
| 30-34 | 26 | 10 | 16 |
| 35-39 | 6 | 1 | 5 |
| 40-49 | 1 | 0 | 1 |
| 50-64 | 1 | 0 | 1 |
| Age | Total | Men | Women |
|---|---|---|---|
| Under 18 | 18 | 12 | 6 |
| 18-19 | 835 | 447 | 388 |
| 20-21 | 898 | 451 | 447 |
| 22-24 | 113 | 41 | 72 |
| 25-29 | 2 | 0 | 2 |
| 30-34 | 1 | 0 | 1 |
| Age | Total | Men | Women |
|---|
Transfer-in Students (Undergraduate)
Among 1,867 enrolled in undergraduate programs, 1 students have transferred-in from other institutions. The percentage of transfer-in students is 0.05%.
| Number of Students | |
|---|---|
| Regular Full-time | 1,858 |
| Transfer-in Full-time | 1 |