Student Population by Gender
Old Dominion University has a total of 23,107 enrolled students for the academic year 2022-2023. 18,375 students have enrolled in undergraduate programs and 4,732 students joined graduate programs.
By gender, 10,102 male and 13,005 female students (the male-female ratio is 44:56) are attending the school. The gender distribution is based on the 2022-2023 data.
| Total | Undergraduate | Graduate | |
|---|---|---|---|
| Total | 23,107 | 18,375 | 4,732 |
| Men | 10,102 | 8,281 | 1,821 |
| Women | 13,005 | 10,094 | 2,911 |
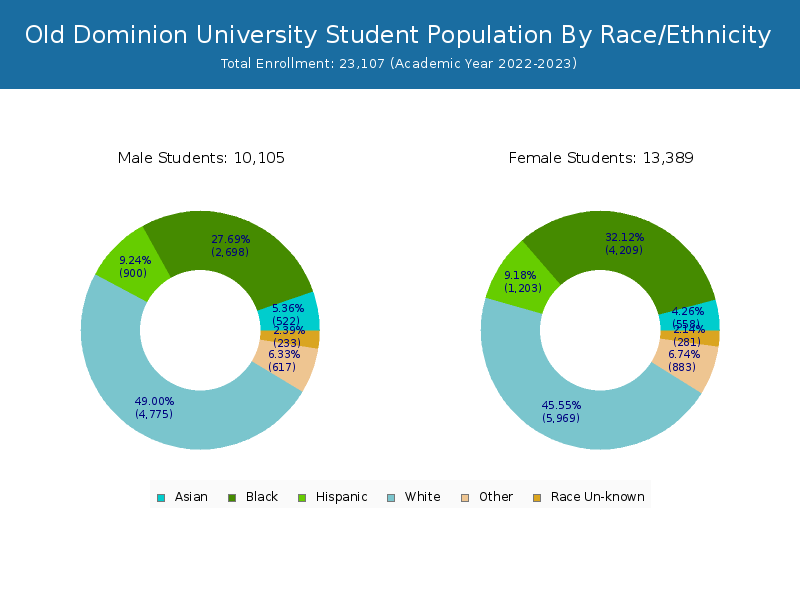
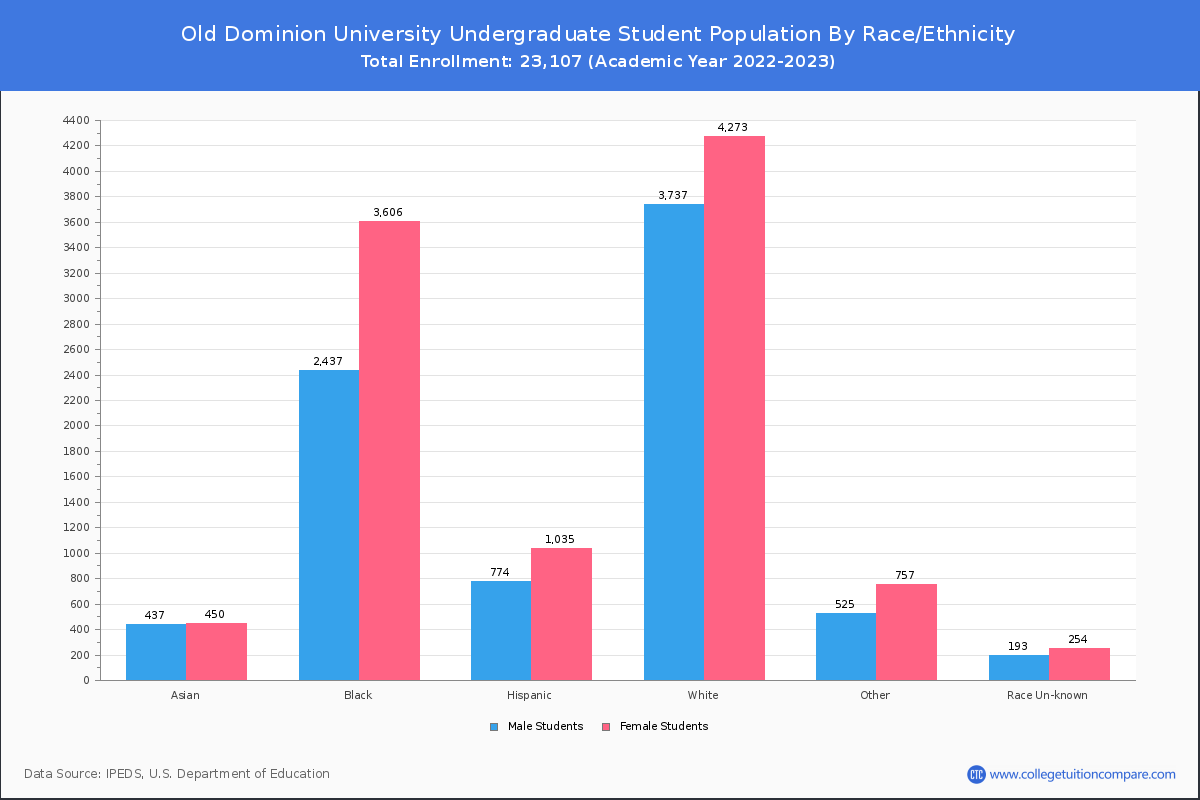
Student Distribution by Race/Ethnicity
By race/ethnicity, 10,366 White, 6,759 Black, and 1,091 Asian students out of a total of 23,107 are attending at Old Dominion University. Comprehensive enrollment statistic data by race/ethnicity is shown in the next chart (Academic year 2022-2023 data).
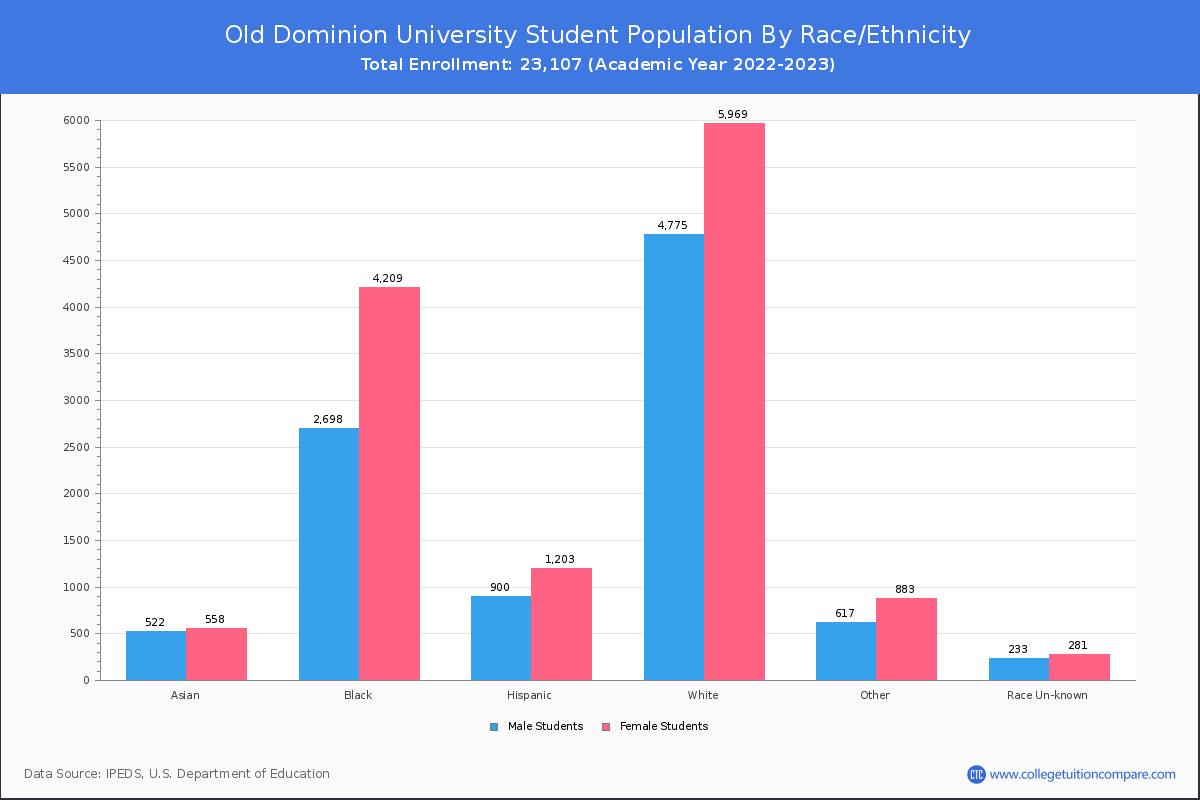
| Race | Total | Men | Women |
|---|---|---|---|
| American Indian or Native American | 57 | 26 | 31 |
| Asian | 1,091 | 546 | 545 |
| Black | 6,759 | 2,711 | 4,048 |
| Hispanic | 2,157 | 908 | 1,249 |
| Native Hawaiian or Other Pacific Islanders | 59 | 20 | 39 |
| White | 10,366 | 4,666 | 5,700 |
| Two or more races | 1,444 | 621 | 823 |
| Race Unknown | 472 | 231 | 241 |
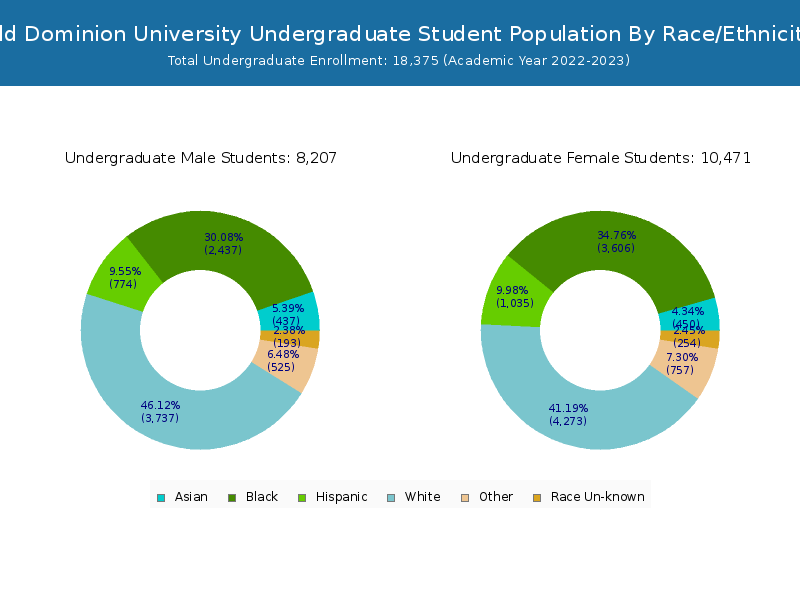
| Race | Total | Men | Women |
|---|---|---|---|
| American Indian or Native American | 42 | 16 | 26 |
| Asian | 909 | 466 | 443 |
| Black | 5,922 | 2,459 | 3,463 |
| Hispanic | 1,868 | 788 | 1,080 |
| Native Hawaiian or Other Pacific Islanders | 48 | 16 | 32 |
| White | 7,742 | 3,703 | 4,039 |
| Two or more races | 1,237 | 543 | 694 |
| Race Unknown | 398 | 186 | 212 |
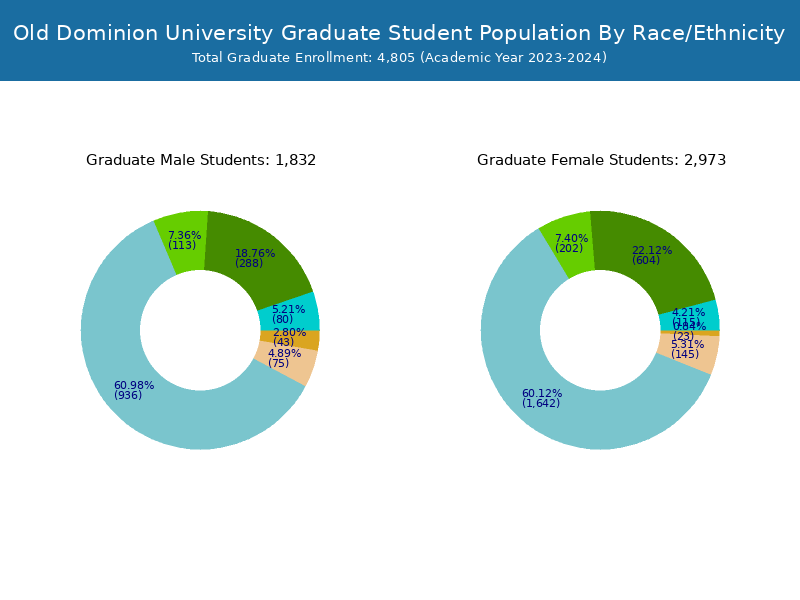
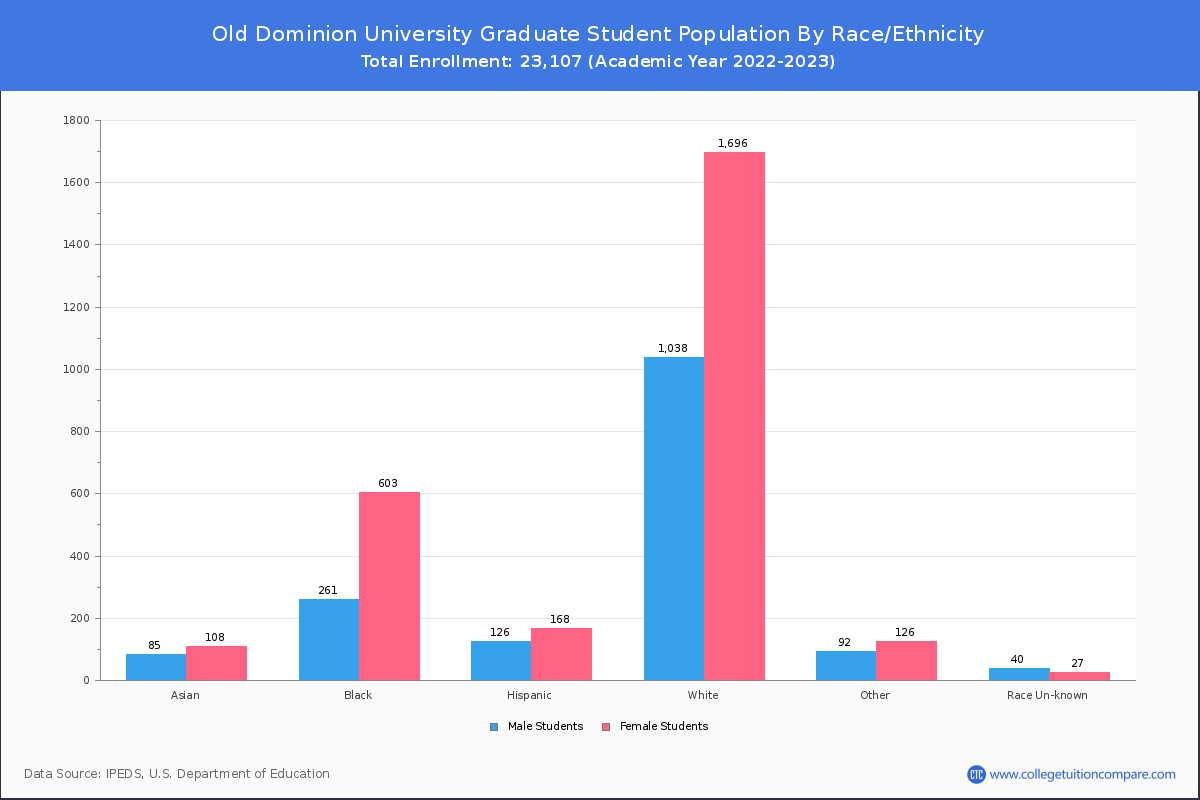
| Race | Total | Men | Women |
|---|---|---|---|
| American Indian or Native American | 9 | 5 | 4 |
| Asian | 71 | 34 | 37 |
| Black | 395 | 159 | 236 |
| Hispanic | 194 | 72 | 122 |
| Native Hawaiian or Other Pacific Islanders | 6 | 2 | 4 |
| White | 948 | 442 | 506 |
| Two or more races | 136 | 65 | 71 |
| Race Unknown | 17 | 11 | 6 |
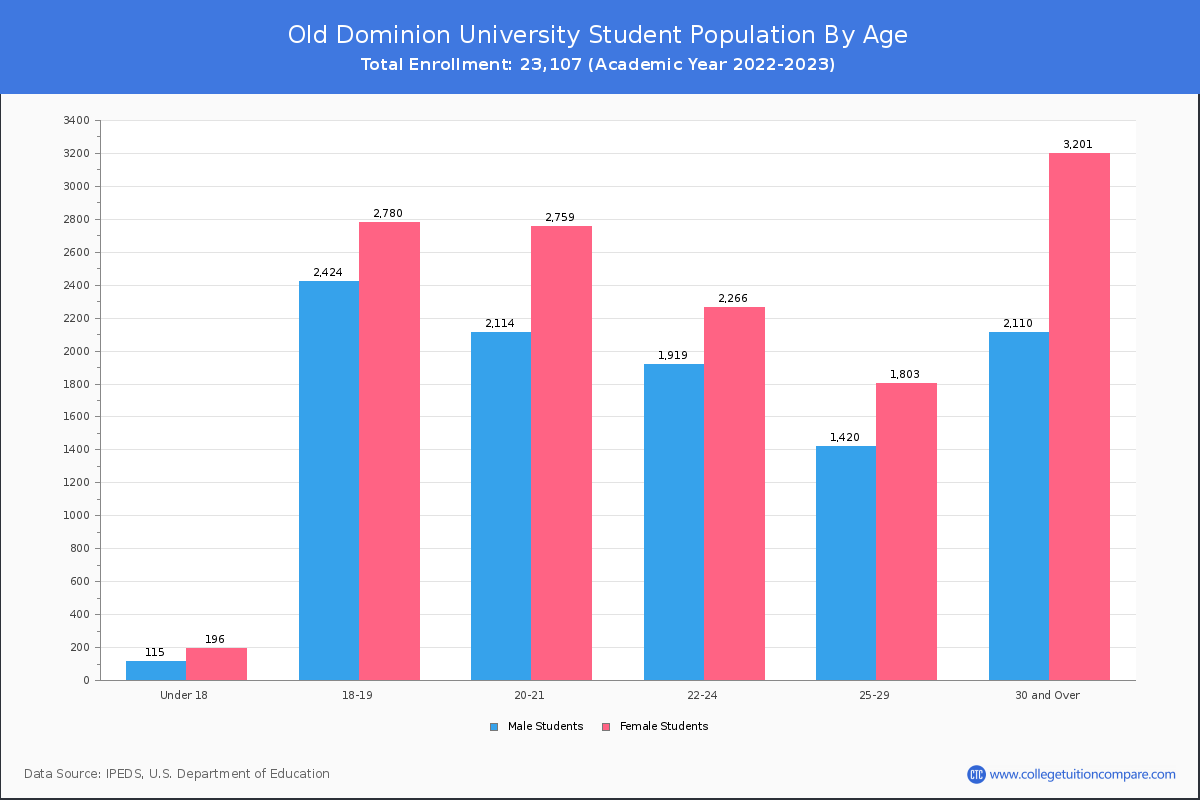
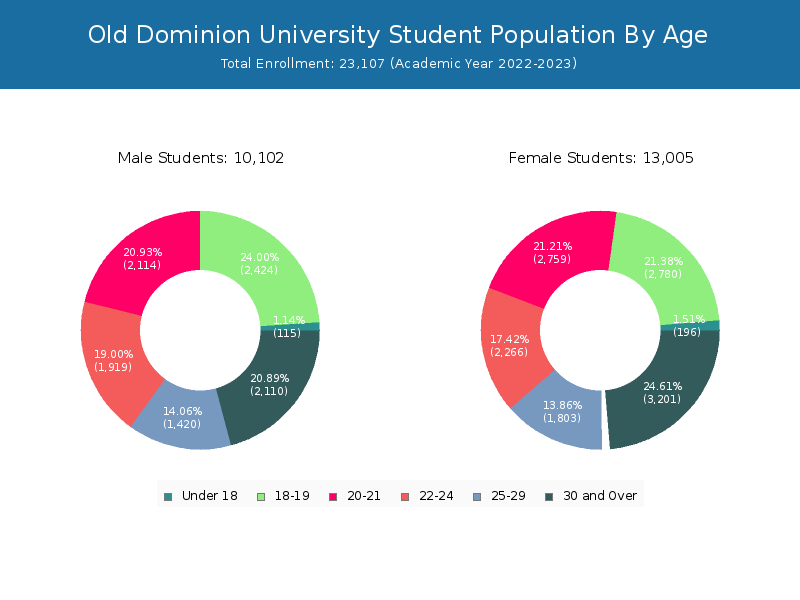
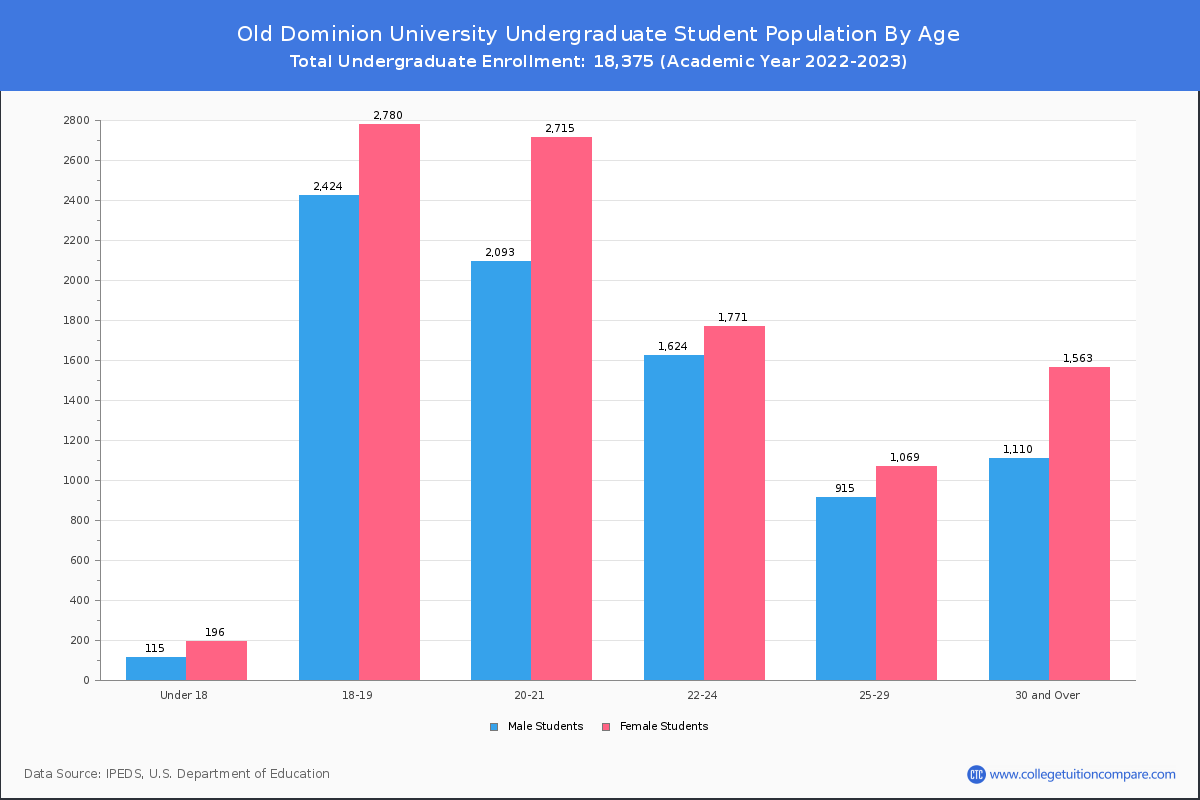
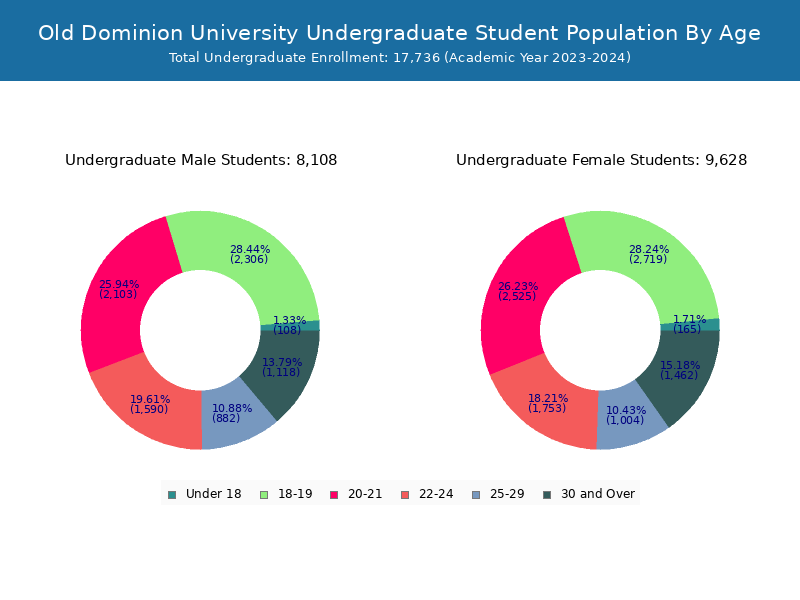
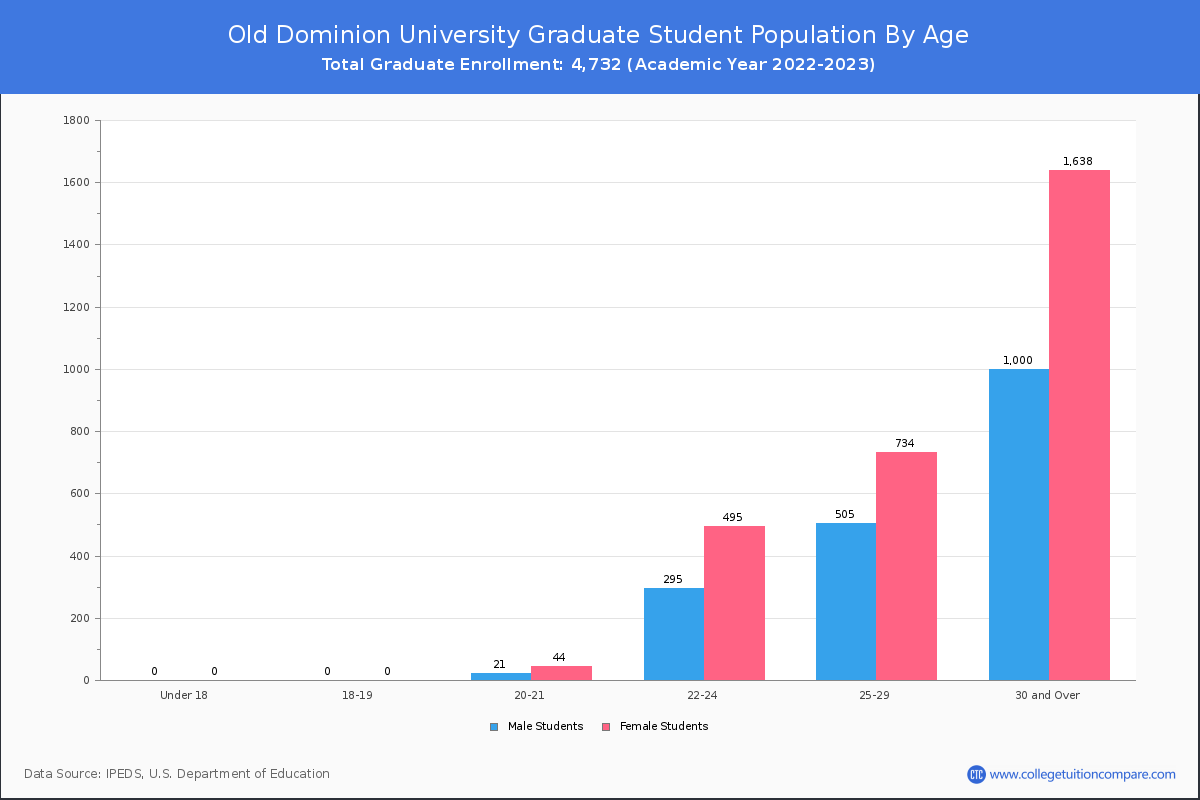
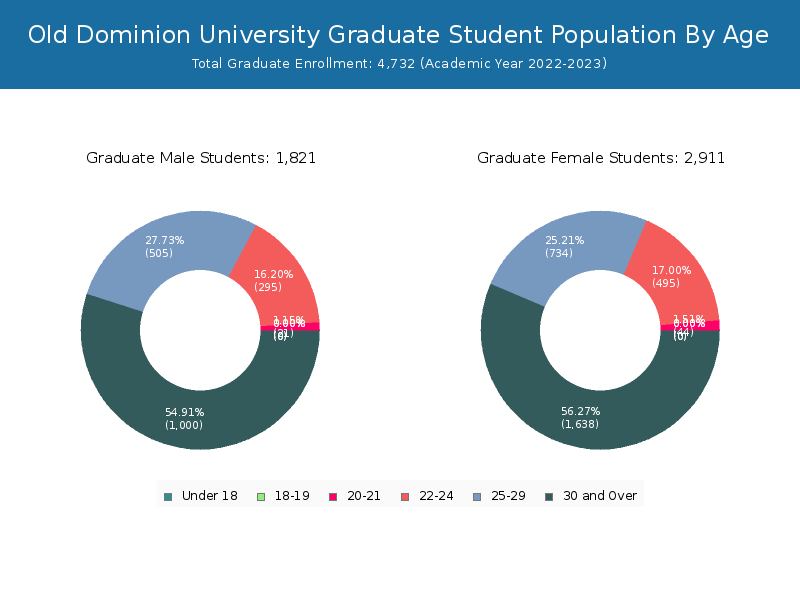
Student Age Distribution
By age, ODU has 311 students under 18 years old and 37 students over 65 years old. There are 14,573 students under 25 years old, and 8,534 students over 25 years old out of 23,107 total students.
In undergraduate programs, 311 students are younger than 18 and 12 students are older than 65. ODU has 13,718 undergraduate students aged under 25 and 4,657 students aged 25 and over.
It has 855 graduate students aged under 25 and 3,877 students aged 25 and over.
| Age | Total | Men | Women |
|---|---|---|---|
| Under 18 | 311 | 196 | 115 |
| 18-19 | 5,204 | 2,780 | 2,424 |
| 20-21 | 4,873 | 2,759 | 2,114 |
| 22-24 | 4,185 | 2,266 | 1,919 |
| 25-29 | 3,223 | 1,803 | 1,420 |
| 30-34 | 2,029 | 1,155 | 874 |
| 35-39 | 1,226 | 726 | 500 |
| 40-49 | 1,355 | 872 | 483 |
| 50-64 | 664 | 427 | 237 |
| Over 65 | 37 | 21 | 16 |
| Age | Total | Men | Women |
|---|---|---|---|
| Under 18 | 311 | 196 | 115 |
| 18-19 | 5,204 | 2,780 | 2,424 |
| 20-21 | 4,808 | 2,715 | 2,093 |
| 22-24 | 3,395 | 1,771 | 1,624 |
| 25-29 | 1,984 | 1,069 | 915 |
| 30-34 | 1,157 | 647 | 510 |
| 35-39 | 638 | 372 | 266 |
| 40-49 | 632 | 379 | 253 |
| 50-64 | 234 | 154 | 80 |
| Over 65 | 12 | 11 | 1 |
| Age | Total | Men | Women |
|---|
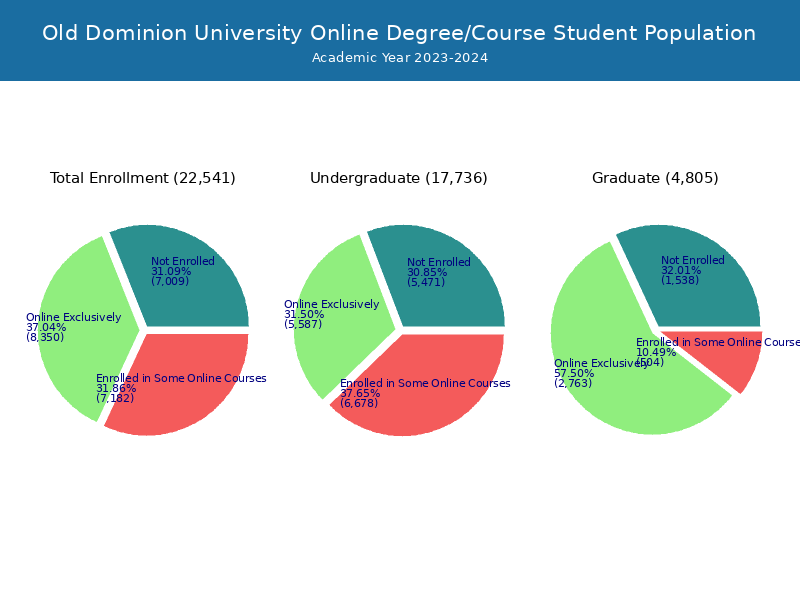
Online Student Enrollment
Distance learning, also called online education, is very attractive to students, especially who want to continue education and work in field. At Old Dominion University, 8,674 students are enrolled exclusively in online courses and 8,020 students are enrolled in some online courses.
7,584 students lived in Virginia or jurisdiction in which the school is located are enrolled exclusively in online courses and 1,090 students live in other State or outside of the United States.
| All Students | Enrolled Exclusively Online Courses | Enrolled in Some Online Courses | |
|---|---|---|---|
| All Students | 23,107 | 8,674 | 8,020 |
| Undergraduate | 18,375 | 5,998 | 7,285 |
| Graduate | 4,732 | 2,676 | 735 |
| Virginia Residents | Other States in U.S. | Outside of U.S. | |
|---|---|---|---|
| All Students | 7,584 | 1,042 | 48 |
| Undergraduate | 5,457 | 514 | 27 |
| Graduate | 2,127 | 528 | 21 |
Transfer-in Students (Undergraduate)
Among 18,375 enrolled in undergraduate programs, 1,792 students have transferred-in from other institutions. The percentage of transfer-in students is 9.75%.1,226 students have transferred in as full-time status and 566 students transferred in as part-time status.
| Number of Students | |
|---|---|
| Regular Full-time | 12,670 |
| Transfer-in Full-time | 1,226 |
| Regular Part-time | 3,913 |
| Transfer-in Part-time | 566 |