Student Population by Gender
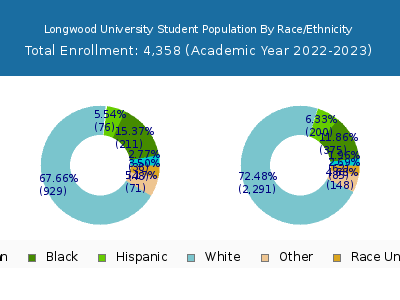
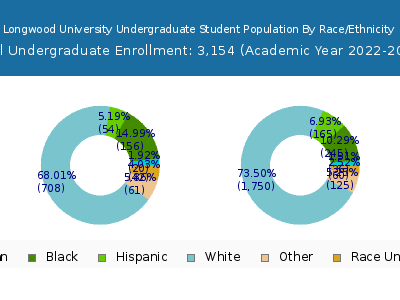
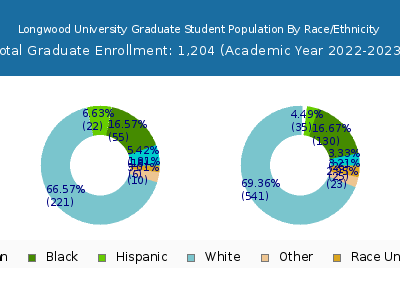
Longwood University has a total of 4,358 enrolled students for the academic year 2022-2023. 3,154 students have enrolled in undergraduate programs and 1,204 students joined graduate programs.
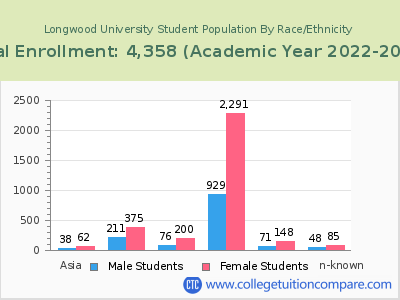
By gender, 1,324 male and 3,034 female students (the male-female ratio is 30:70) are attending the school. The gender distribution is based on the 2022-2023 data.
| Total | Undergraduate | Graduate | |
|---|---|---|---|
| Total | 4,358 | 3,154 | 1,204 |
| Men | 1,324 | 961 | 363 |
| Women | 3,034 | 2,193 | 841 |
Student Distribution by Race/Ethnicity
| Race | Total | Men | Women |
|---|---|---|---|
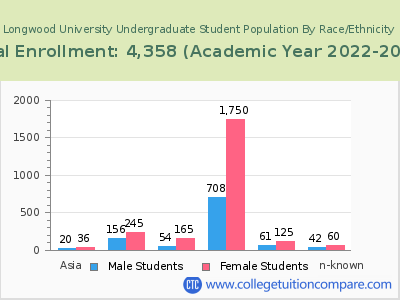
| American Indian or Native American | 9 | 3 | 6 |
| Asian | 86 | 24 | 62 |
| Black | 510 | 169 | 341 |
| Hispanic | 276 | 84 | 192 |
| Native Hawaiian or Other Pacific Islanders | 2 | 0 | 2 |
| White | 3,079 | 883 | 2,196 |
| Two or more races | 202 | 60 | 142 |
| Race Unknown | 123 | 62 | 61 |
| Race | Total | Men | Women |
|---|---|---|---|
| American Indian or Native American | 9 | 3 | 6 |
| Asian | 52 | 11 | 41 |
| Black | 338 | 123 | 215 |
| Hispanic | 206 | 60 | 146 |
| Native Hawaiian or Other Pacific Islanders | 1 | 0 | 1 |
| White | 2,249 | 648 | 1,601 |
| Two or more races | 164 | 46 | 118 |
| Race Unknown | 90 | 47 | 43 |
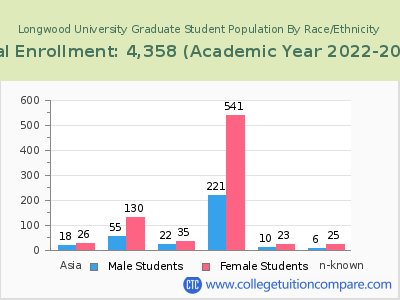
| Race | Total | Men | Women |
|---|---|---|---|
| American Indian or Native American | 0 | 0 | 0 |
| Asian | 1 | 0 | 1 |
| Black | 18 | 6 | 12 |
| Hispanic | 8 | 3 | 5 |
| Native Hawaiian or Other Pacific Islanders | 0 | 0 | 0 |
| White | 100 | 35 | 65 |
| Two or more races | 8 | 1 | 7 |
| Race Unknown | 0 | 0 | 0 |
Student Age Distribution
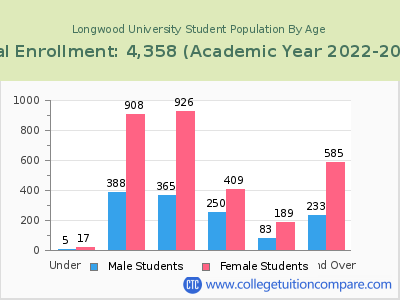
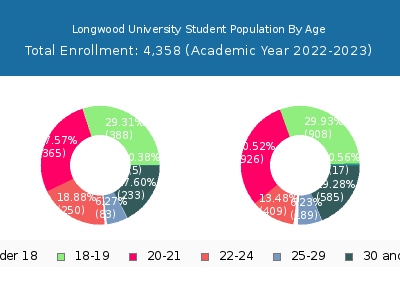
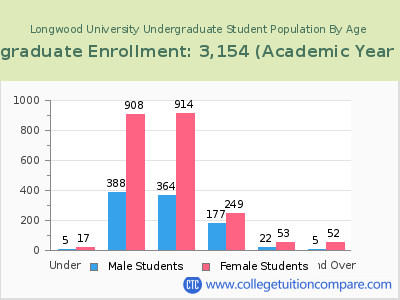
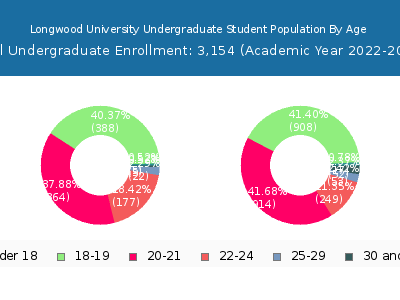
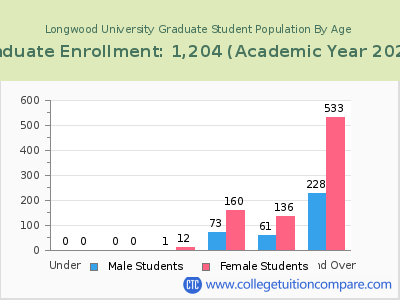
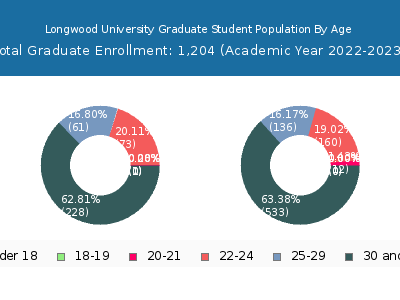
By age, Longwood has 22 students under 18 years old and 2 students over 65 years old. There are 3,268 students under 25 years old, and 1,090 students over 25 years old out of 4,358 total students.
Longwood has 3,022 undergraduate students aged under 25 and 132 students aged 25 and over.
It has 246 graduate students aged under 25 and 958 students aged 25 and over.
| Age | Total | Men | Women |
|---|---|---|---|
| Under 18 | 22 | 17 | 5 |
| 18-19 | 1,296 | 908 | 388 |
| 20-21 | 1,291 | 926 | 365 |
| 22-24 | 659 | 409 | 250 |
| 25-29 | 272 | 189 | 83 |
| 30-34 | 211 | 148 | 63 |
| 35-39 | 190 | 130 | 60 |
| 40-49 | 279 | 209 | 70 |
| 50-64 | 136 | 97 | 39 |
| Over 65 | 2 | 1 | 1 |
| Age | Total | Men | Women |
|---|---|---|---|
| Under 18 | 22 | 17 | 5 |
| 18-19 | 1,296 | 908 | 388 |
| 20-21 | 1,278 | 914 | 364 |
| 22-24 | 426 | 249 | 177 |
| 25-29 | 75 | 53 | 22 |
| 30-34 | 23 | 22 | 1 |
| 35-39 | 17 | 15 | 2 |
| 40-49 | 15 | 13 | 2 |
| 50-64 | 2 | 2 | 0 |
| Age | Total | Men | Women |
|---|
Online Student Enrollment
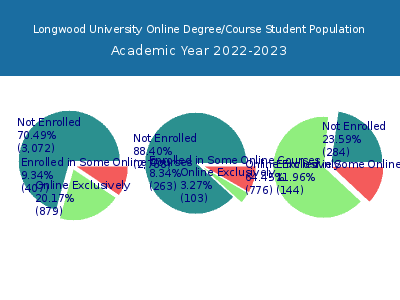
Distance learning, also called online education, is very attractive to students, especially who want to continue education and work in field. At Longwood University, 879 students are enrolled exclusively in online courses and 407 students are enrolled in some online courses.
639 students lived in Virginia or jurisdiction in which the school is located are enrolled exclusively in online courses and 240 students live in other State or outside of the United States.
| All Students | Enrolled Exclusively Online Courses | Enrolled in Some Online Courses | |
|---|---|---|---|
| All Students | 4,358 | 879 | 407 |
| Undergraduate | 3,154 | 103 | 263 |
| Graduate | 1,204 | 776 | 144 |
| Virginia Residents | Other States in U.S. | Outside of U.S. | |
|---|---|---|---|
| All Students | 639 | 239 | 1 |
| Undergraduate | 37 | 65 | 1 |
| Graduate | 602 | 174 | 0 |
Transfer-in Students (Undergraduate)
Among 3,154 enrolled in undergraduate programs, 138 students have transferred-in from other institutions. The percentage of transfer-in students is 4.38%.129 students have transferred in as full-time status and 9 students transferred in as part-time status.
| Number of Students | |
|---|---|
| Regular Full-time | 2,742 |
| Transfer-in Full-time | 129 |
| Regular Part-time | 274 |
| Transfer-in Part-time | 9 |
