Student Population by Gender
Liberty University has a total of 96,709 enrolled students for the academic year 2022-2023. 48,906 students have enrolled in undergraduate programs and 47,803 students joined graduate programs.
By gender, 39,998 male and 56,711 female students (the male-female ratio is 41:59) are attending the school. The gender distribution is based on the 2022-2023 data.
| Total | Undergraduate | Graduate | |
|---|---|---|---|
| Total | 96,709 | 48,906 | 47,803 |
| Men | 39,998 | 21,351 | 18,647 |
| Women | 56,711 | 27,555 | 29,156 |
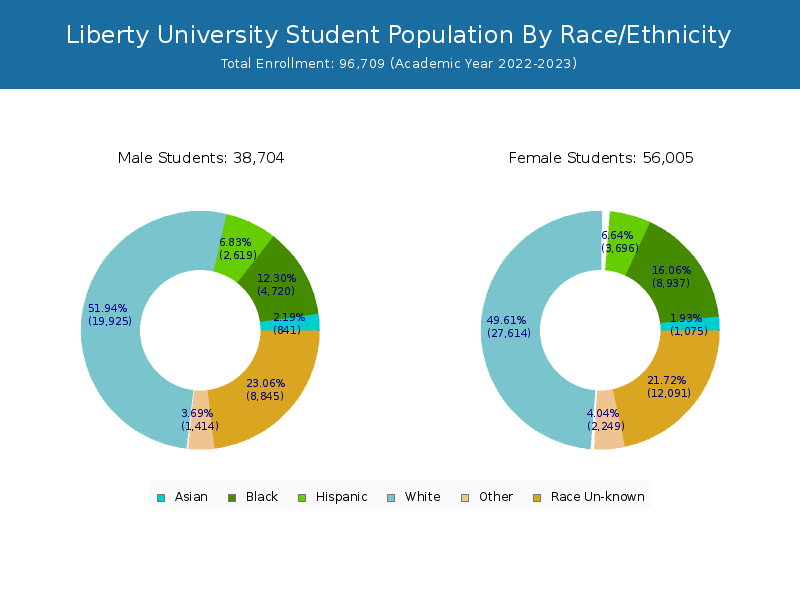

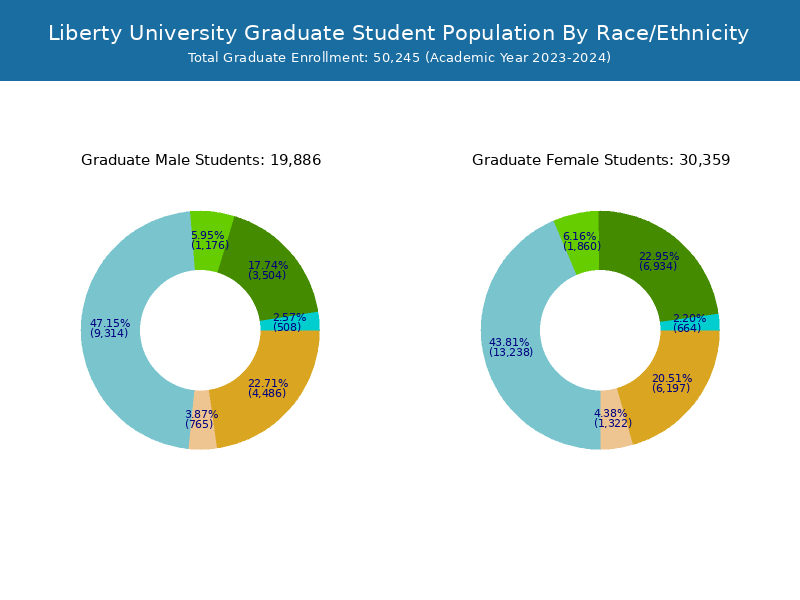
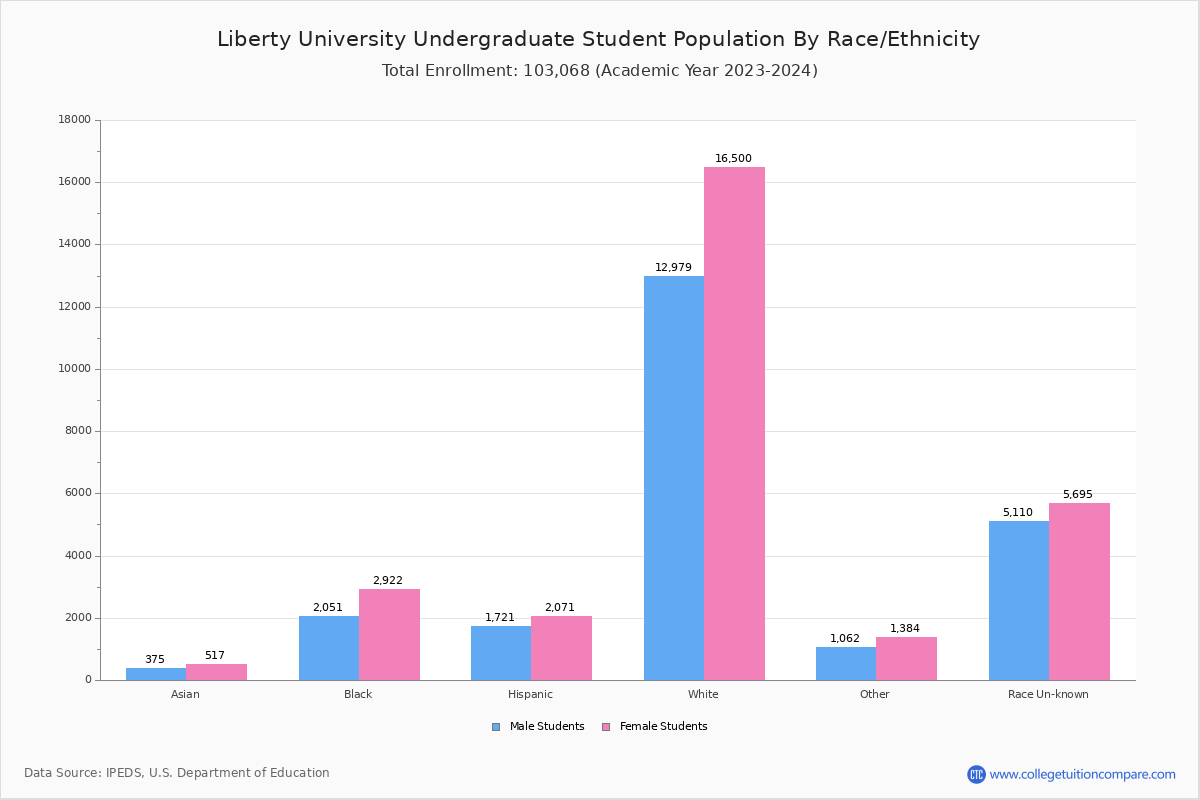
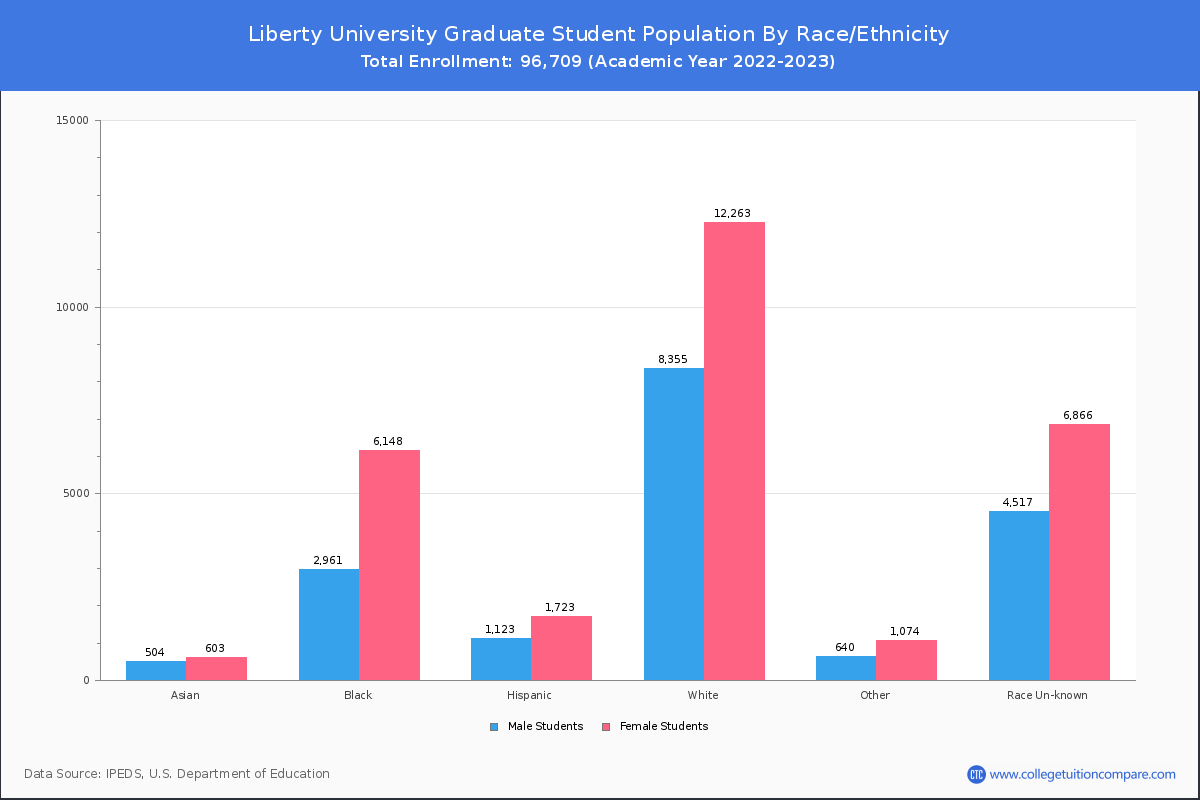
Student Distribution by Race/Ethnicity
By race/ethnicity, 49,461 White, 14,119 Black, and 1,945 Asian students out of a total of 96,709 are attending at Liberty University. Comprehensive enrollment statistic data by race/ethnicity is shown in the next chart (Academic year 2022-2023 data).

| Race | Total | Men | Women |
|---|---|---|---|
| American Indian or Native American | 408 | 156 | 252 |
| Asian | 1,945 | 859 | 1,086 |
| Black | 14,119 | 4,969 | 9,150 |
| Hispanic | 6,112 | 2,455 | 3,657 |
| Native Hawaiian or Other Pacific Islanders | 257 | 115 | 142 |
| White | 49,461 | 20,866 | 28,595 |
| Two or more races | 3,480 | 1,350 | 2,130 |
| Race Unknown | 20,250 | 8,895 | 11,355 |
| Race | Total | Men | Women |
|---|---|---|---|
| American Indian or Native American | 202 | 77 | 125 |
| Asian | 848 | 372 | 476 |
| Black | 4,587 | 1,833 | 2,754 |
| Hispanic | 3,451 | 1,471 | 1,980 |
| Native Hawaiian or Other Pacific Islanders | 117 | 49 | 68 |
| White | 28,120 | 12,210 | 15,910 |
| Two or more races | 1,864 | 760 | 1,104 |
| Race Unknown | 9,276 | 4,352 | 4,924 |
| Race | Total | Men | Women |
|---|---|---|---|
| American Indian or Native American | 15 | 7 | 8 |
| Asian | 89 | 44 | 45 |
| Black | 604 | 219 | 385 |
| Hispanic | 443 | 184 | 259 |
| Native Hawaiian or Other Pacific Islanders | 15 | 7 | 8 |
| White | 2,719 | 1,183 | 1,536 |
| Two or more races | 186 | 74 | 112 |
| Race Unknown | 1,326 | 615 | 711 |
Student Age Distribution
By age, Liberty has 186 students under 18 years old and 1,316 students over 65 years old. There are 28,655 students under 25 years old, and 67,228 students over 25 years old out of 96,709 total students.
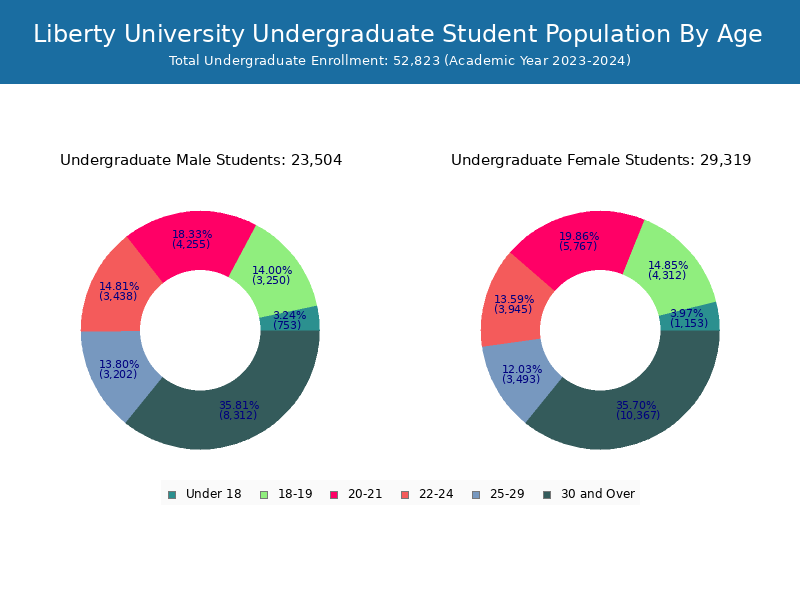
In undergraduate programs, 184 students are younger than 18 and 293 students are older than 65. Liberty has 24,307 undergraduate students aged under 25 and 24,101 students aged 25 and over.
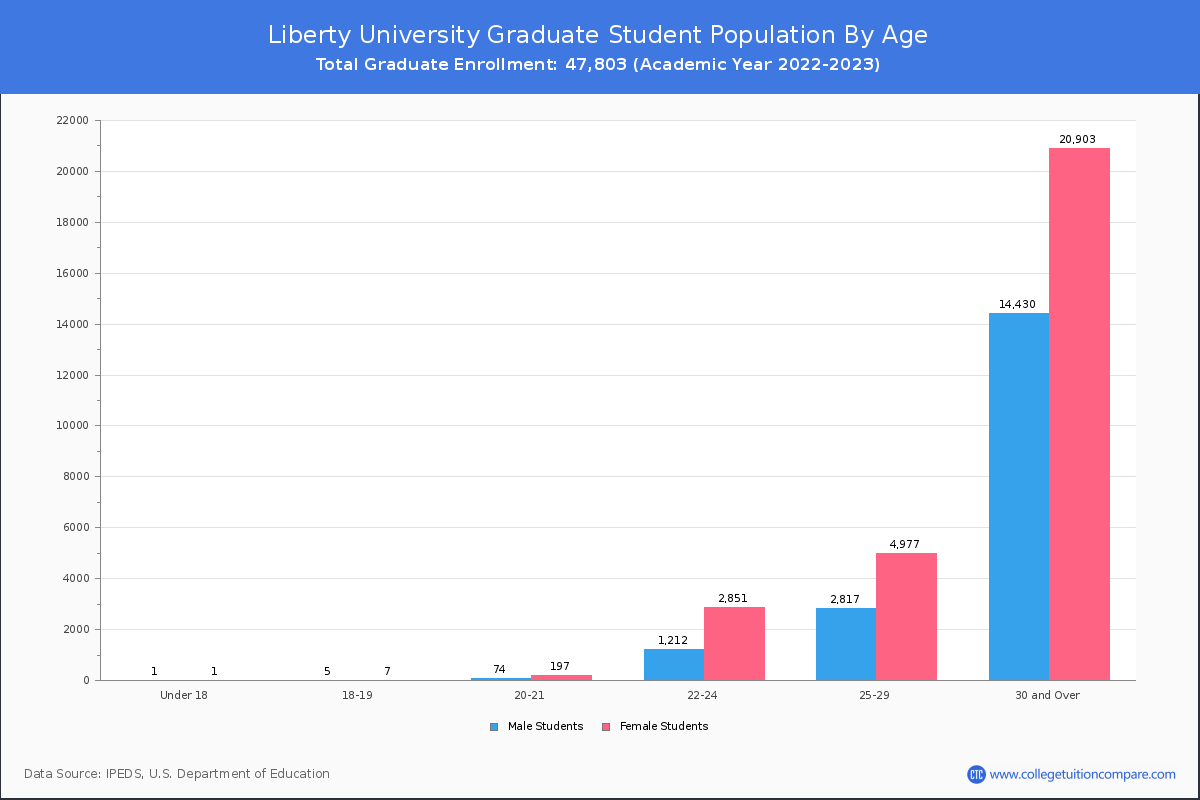
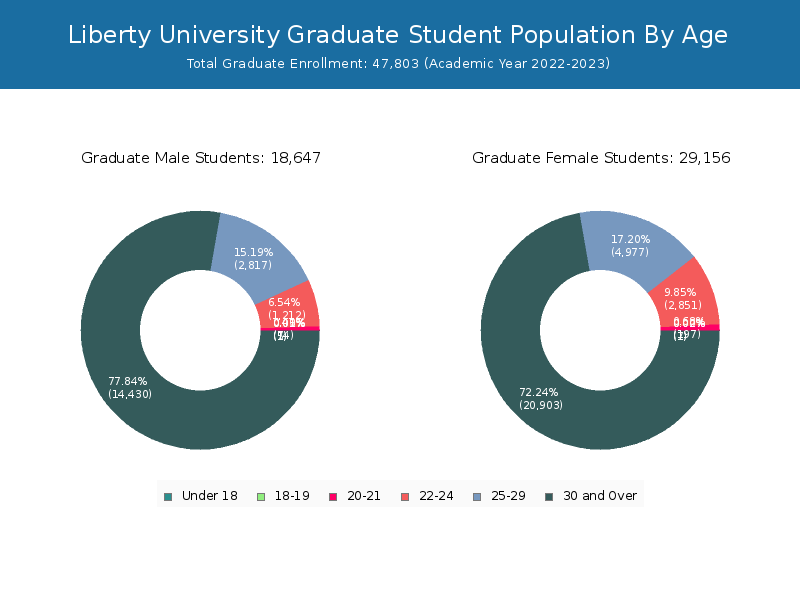
In graduate schools at Liberty, 2 students are younger than 18 and 1,023 students are older than 65. It has 4,348 graduate students aged under 25 and 43,127 students aged 25 and over.
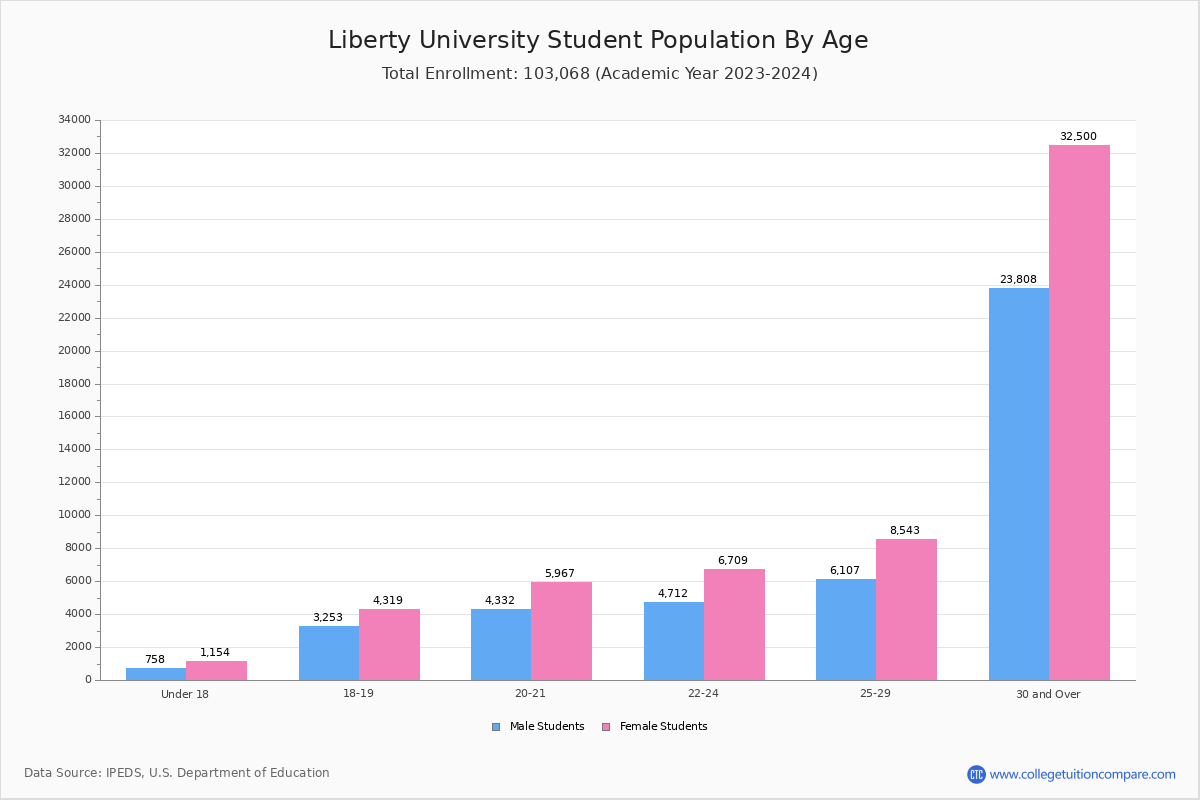


| Age | Total | Men | Women |
|---|---|---|---|
| Under 18 | 186 | 120 | 66 |
| 18-19 | 7,399 | 4,370 | 3,029 |
| 20-21 | 9,950 | 5,824 | 4,126 |
| 22-24 | 11,120 | 6,773 | 4,347 |
| 25-29 | 14,377 | 8,456 | 5,921 |
| 30-34 | 11,745 | 6,668 | 5,077 |
| 35-39 | 10,882 | 6,169 | 4,713 |
| 40-49 | 16,970 | 10,183 | 6,787 |
| 50-64 | 11,938 | 7,009 | 4,929 |
| Over 65 | 1,316 | 704 | 612 |
| Age | Total | Men | Women |
|---|---|---|---|
| Under 18 | 184 | 119 | 65 |
| 18-19 | 7,387 | 4,363 | 3,024 |
| 20-21 | 9,679 | 5,627 | 4,052 |
| 22-24 | 7,057 | 3,922 | 3,135 |
| 25-29 | 6,583 | 3,479 | 3,104 |
| 30-34 | 4,989 | 2,639 | 2,350 |
| 35-39 | 4,090 | 2,243 | 1,847 |
| 40-49 | 5,162 | 3,011 | 2,151 |
| 50-64 | 2,984 | 1,779 | 1,205 |
| Over 65 | 293 | 158 | 135 |
| Age | Total | Men | Women |
|---|---|---|---|
| Under 18 | 2 | 1 | 1 |
| 18-19 | 12 | 7 | 5 |
| 20-21 | 271 | 197 | 74 |
| 22-24 | 4,063 | 2,851 | 1,212 |
| 25-29 | 7,794 | 4,977 | 2,817 |
| 30-34 | 6,756 | 4,029 | 2,727 |
| 35-39 | 6,792 | 3,926 | 2,866 |
| 40-49 | 11,808 | 7,172 | 4,636 |
| 50-64 | 8,954 | 5,230 | 3,724 |
| Over 65 | 1,023 | 546 | 477 |
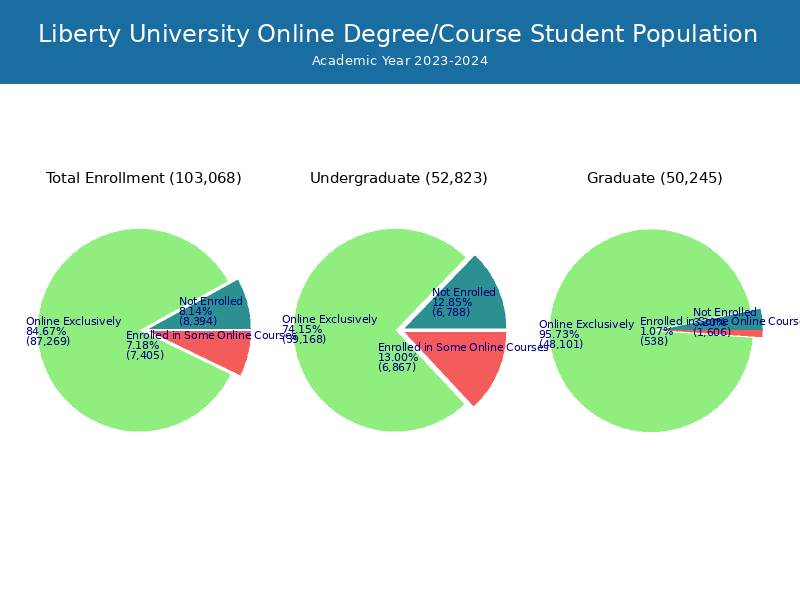
Online Student Enrollment
Distance learning, also called online education, is very attractive to students, especially who want to continue education and work in field. At Liberty University, 81,026 students are enrolled exclusively in online courses and 7,031 students are enrolled in some online courses.
12,863 students lived in Virginia or jurisdiction in which the school is located are enrolled exclusively in online courses and 68,163 students live in other State or outside of the United States.
| All Students | Enrolled Exclusively Online Courses | Enrolled in Some Online Courses | |
|---|---|---|---|
| All Students | 96,709 | 81,026 | 7,031 |
| Undergraduate | 48,906 | 35,243 | 6,559 |
| Graduate | 47,803 | 45,783 | 472 |
| Virginia Residents | Other States in U.S. | Outside of U.S. | |
|---|---|---|---|
| All Students | 12,863 | 67,202 | 961 |
| Undergraduate | 6,023 | 28,889 | 331 |
| Graduate | 6,840 | 38,313 | 630 |
Transfer-in Students (Undergraduate)
Among 48,906 enrolled in undergraduate programs, 5,429 students have transferred-in from other institutions. The percentage of transfer-in students is 11.10%.3,161 students have transferred in as full-time status and 2,268 students transferred in as part-time status.
| Number of Students | |
|---|---|
| Regular Full-time | 27,873 |
| Transfer-in Full-time | 3,161 |
| Regular Part-time | 15,604 |
| Transfer-in Part-time | 2,268 |