Student Population by Gender
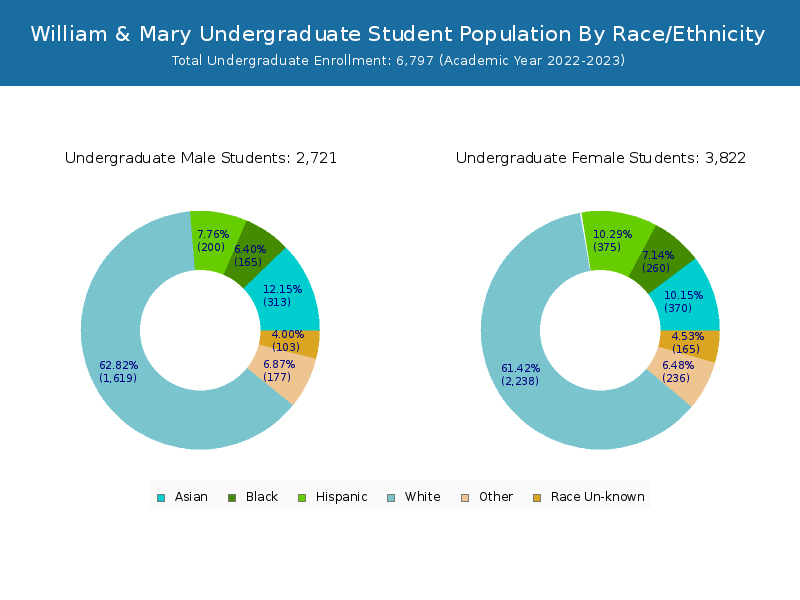
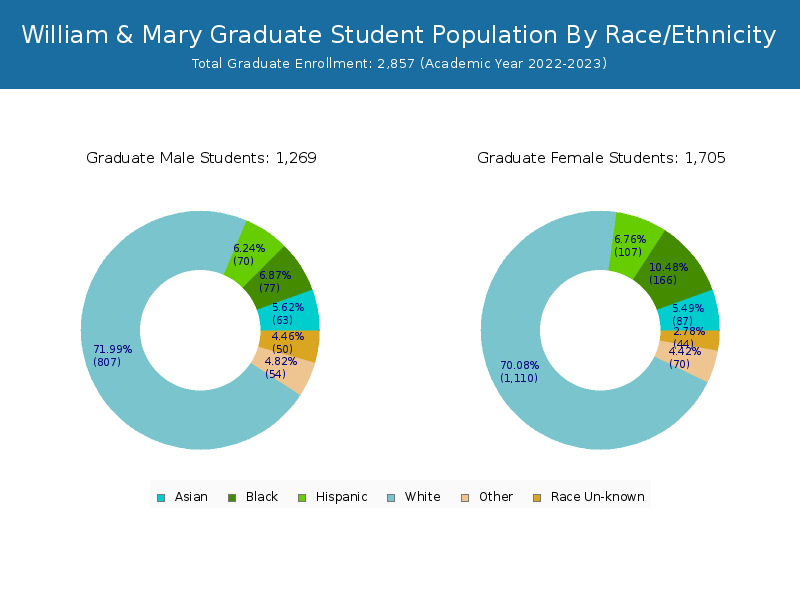
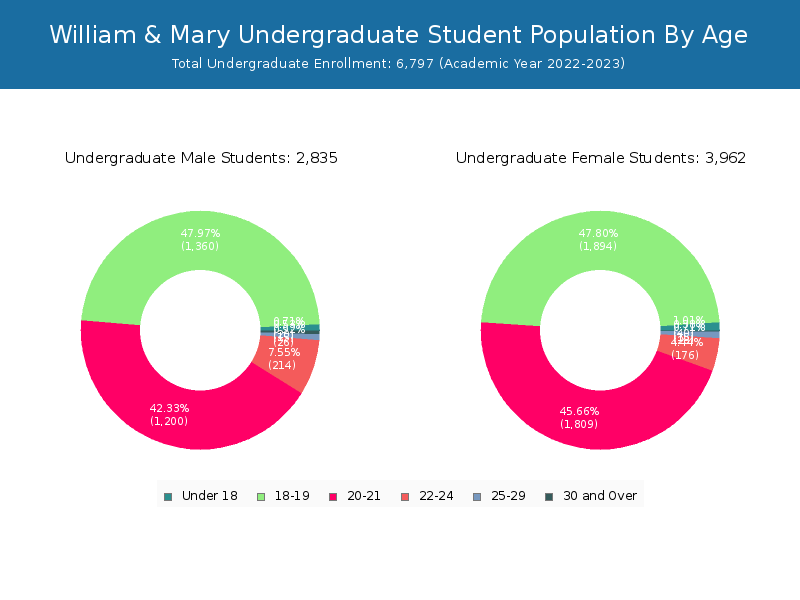
William & Mary has a total of 9,654 enrolled students for the academic year 2022-2023. 6,797 students have enrolled in undergraduate programs and 2,857 students joined graduate programs.
By gender, 4,052 male and 5,602 female students (the male-female ratio is 42:58) are attending the school. The gender distribution is based on the 2022-2023 data.
| Total | Undergraduate | Graduate | |
|---|---|---|---|
| Total | 9,654 | 6,797 | 2,857 |
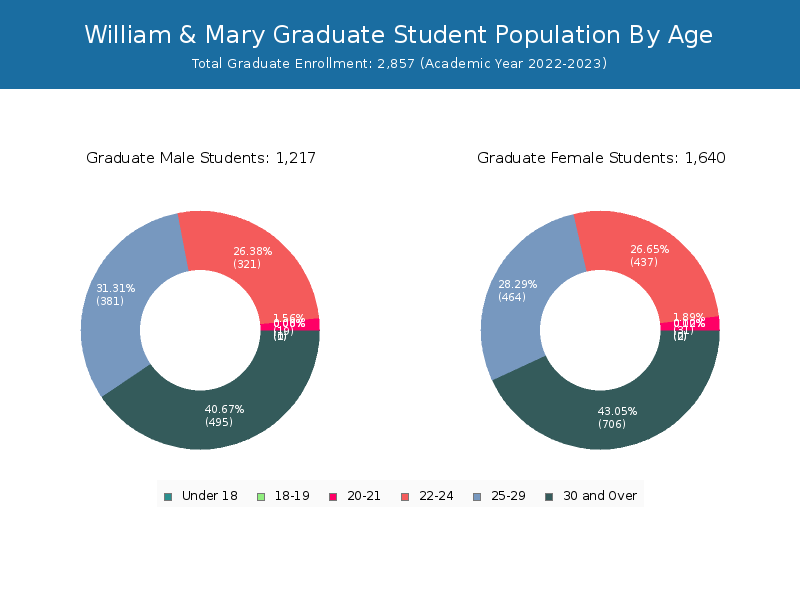
| Men | 4,052 | 2,835 | 1,217 |
| Women | 5,602 | 3,962 | 1,640 |
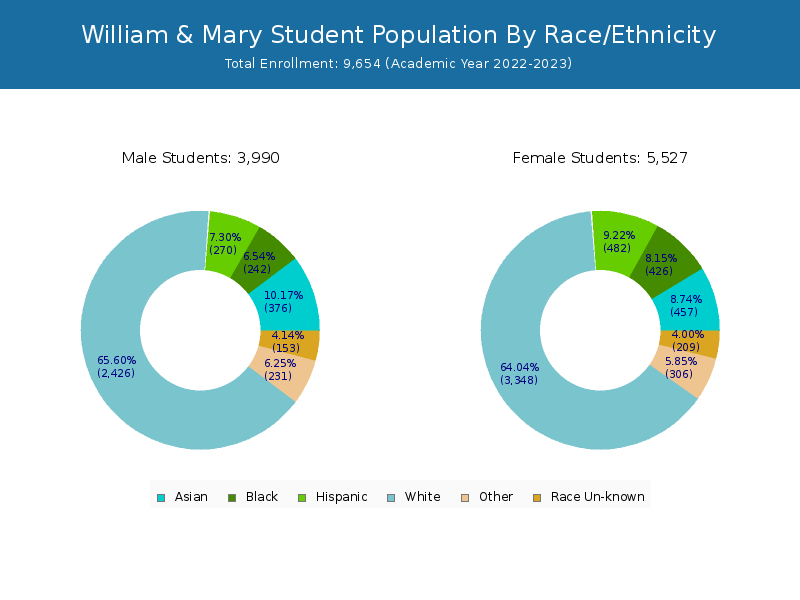
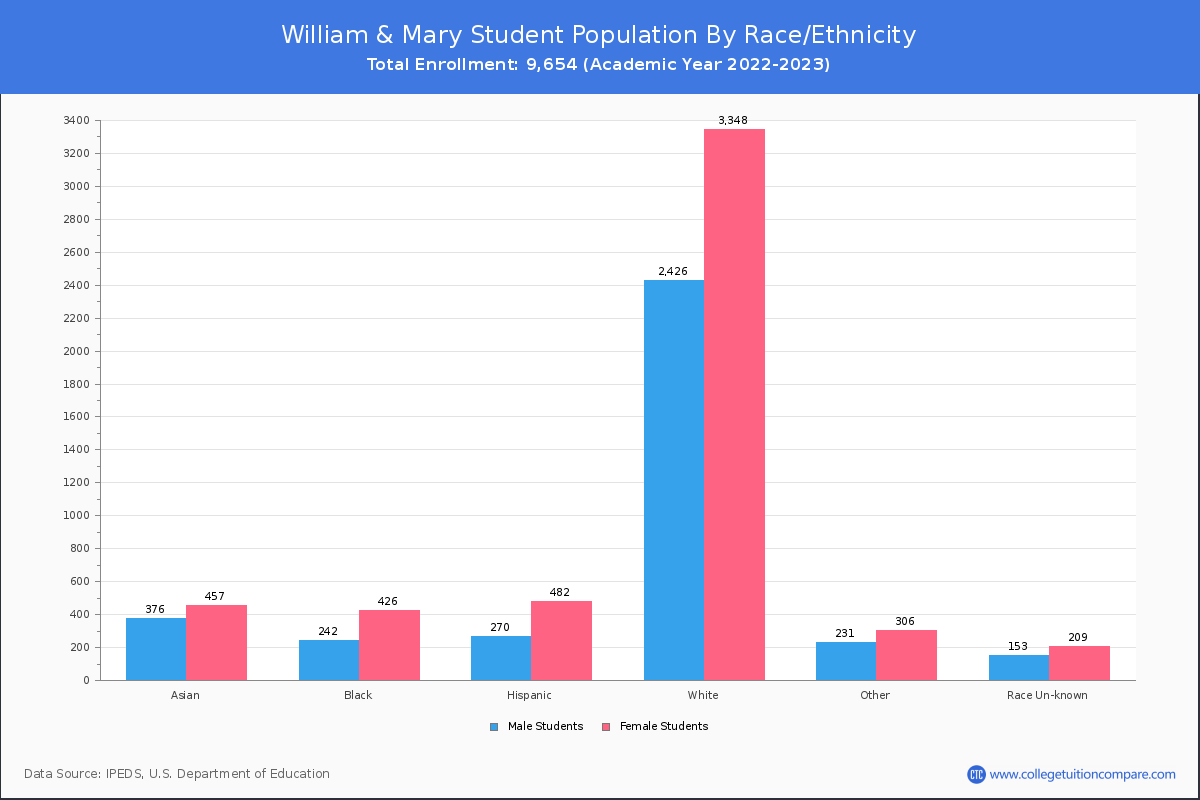
Student Distribution by Race/Ethnicity
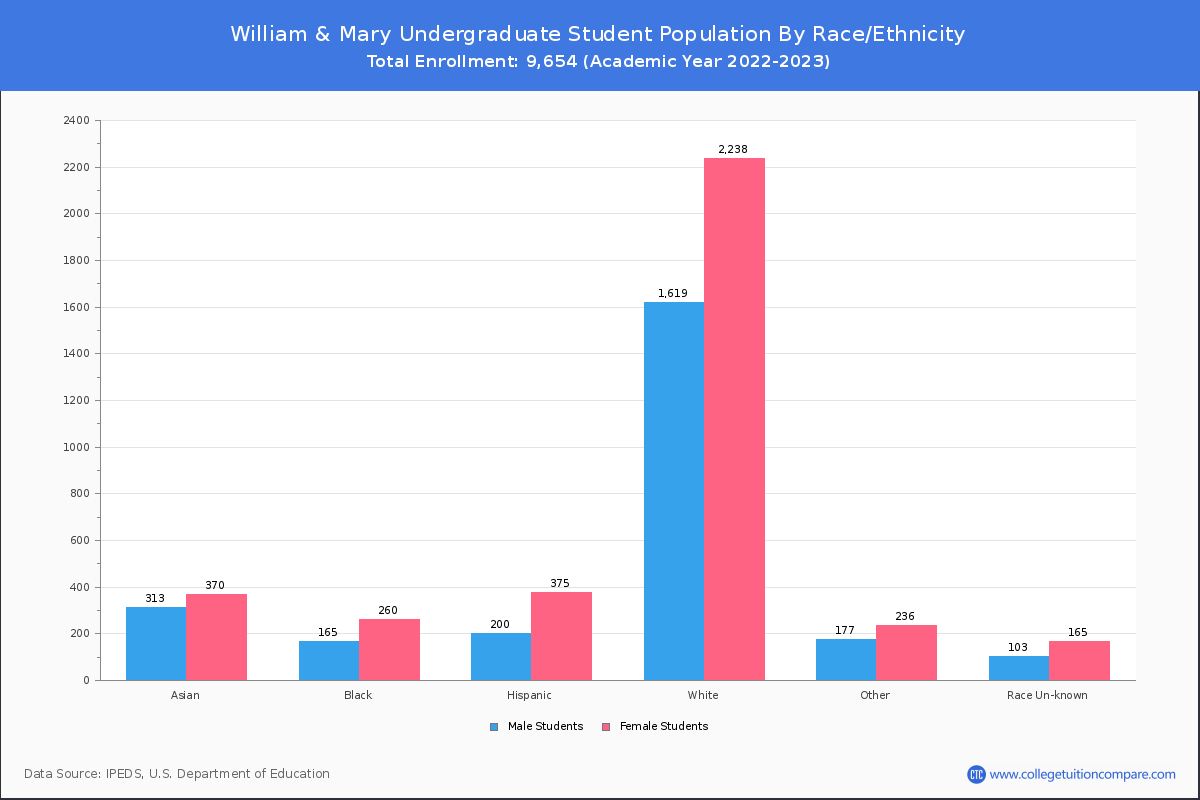
By race/ethnicity, 5,884 White, 655 Black, and 913 Asian students out of a total of 9,654 are attending at William & Mary. Comprehensive enrollment statistic data by race/ethnicity is shown in the next chart (Academic year 2022-2023 data).
| Race | Total | Men | Women |
|---|---|---|---|
| American Indian or Native American | 10 | 5 | 5 |
| Asian | 913 | 417 | 496 |
| Black | 655 | 232 | 423 |
| Hispanic | 792 | 300 | 492 |
| Native Hawaiian or Other Pacific Islanders | 9 | 4 | 5 |
| White | 5,884 | 2,475 | 3,409 |
| Two or more races | 566 | 231 | 335 |
| Race Unknown | 284 | 121 | 163 |
| Race | Total | Men | Women |
|---|---|---|---|
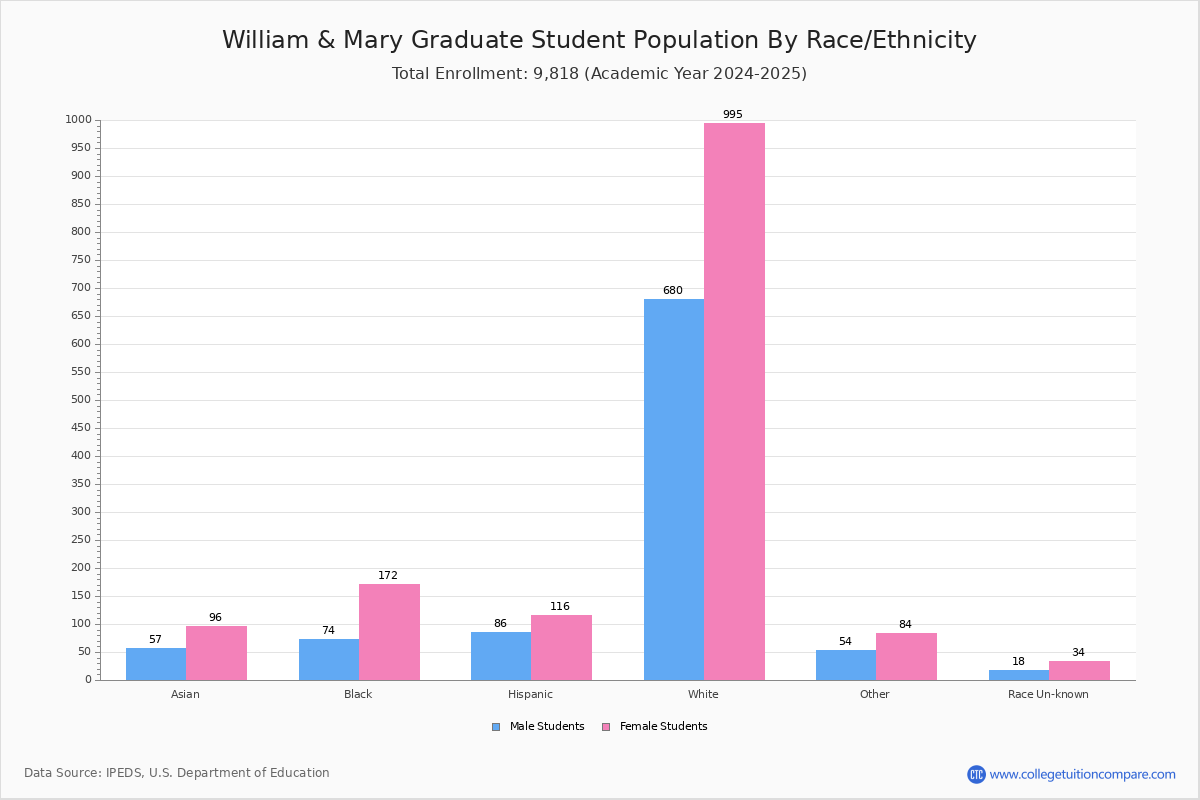
| American Indian or Native American | 6 | 2 | 4 |
| Asian | 768 | 350 | 418 |
| Black | 398 | 149 | 249 |
| Hispanic | 612 | 221 | 391 |
| Native Hawaiian or Other Pacific Islanders | 5 | 3 | 2 |
| White | 4,072 | 1,715 | 2,357 |
| Two or more races | 443 | 181 | 262 |
| Race Unknown | 201 | 79 | 122 |
| Race | Total | Men | Women |
|---|---|---|---|
| American Indian or Native American | 0 | 0 | 0 |
| Asian | 13 | 6 | 7 |
| Black | 11 | 3 | 8 |
| Hispanic | 16 | 5 | 11 |
| Native Hawaiian or Other Pacific Islanders | 0 | 0 | 0 |
| White | 98 | 45 | 53 |
| Two or more races | 5 | 3 | 2 |
| Race Unknown | 5 | 3 | 2 |
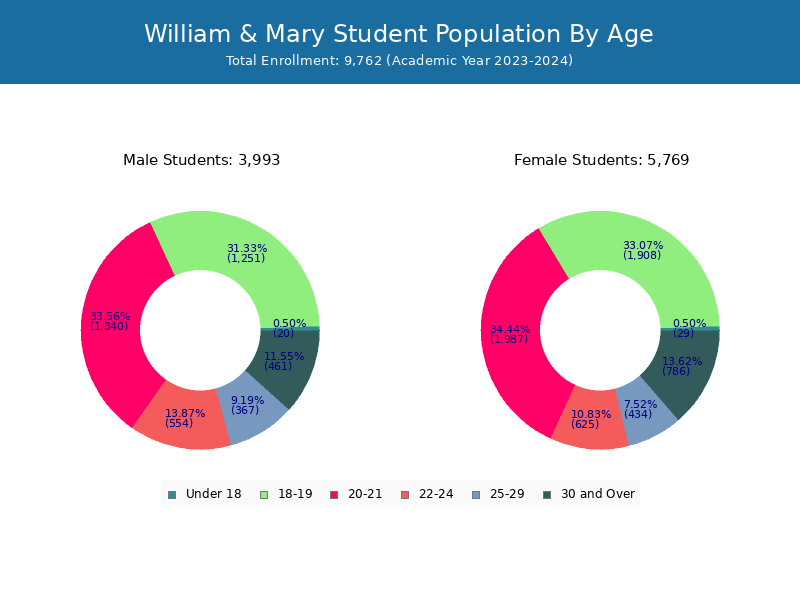
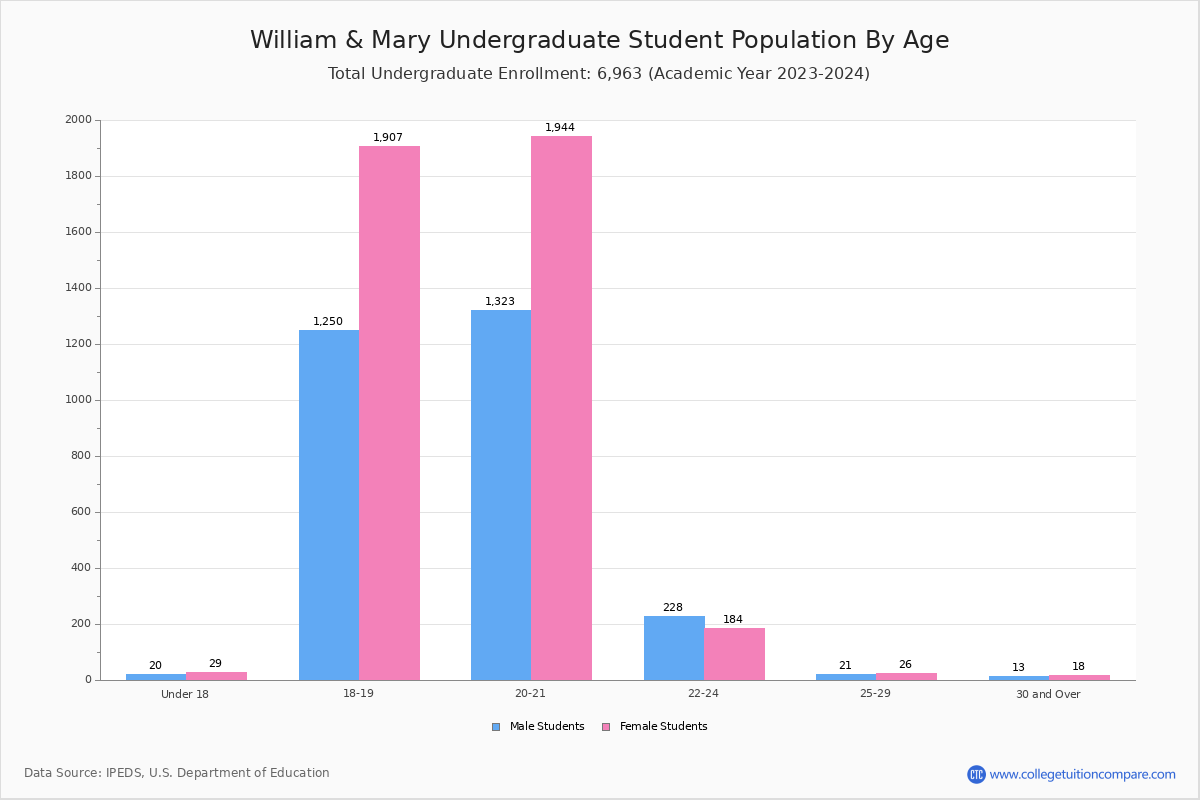
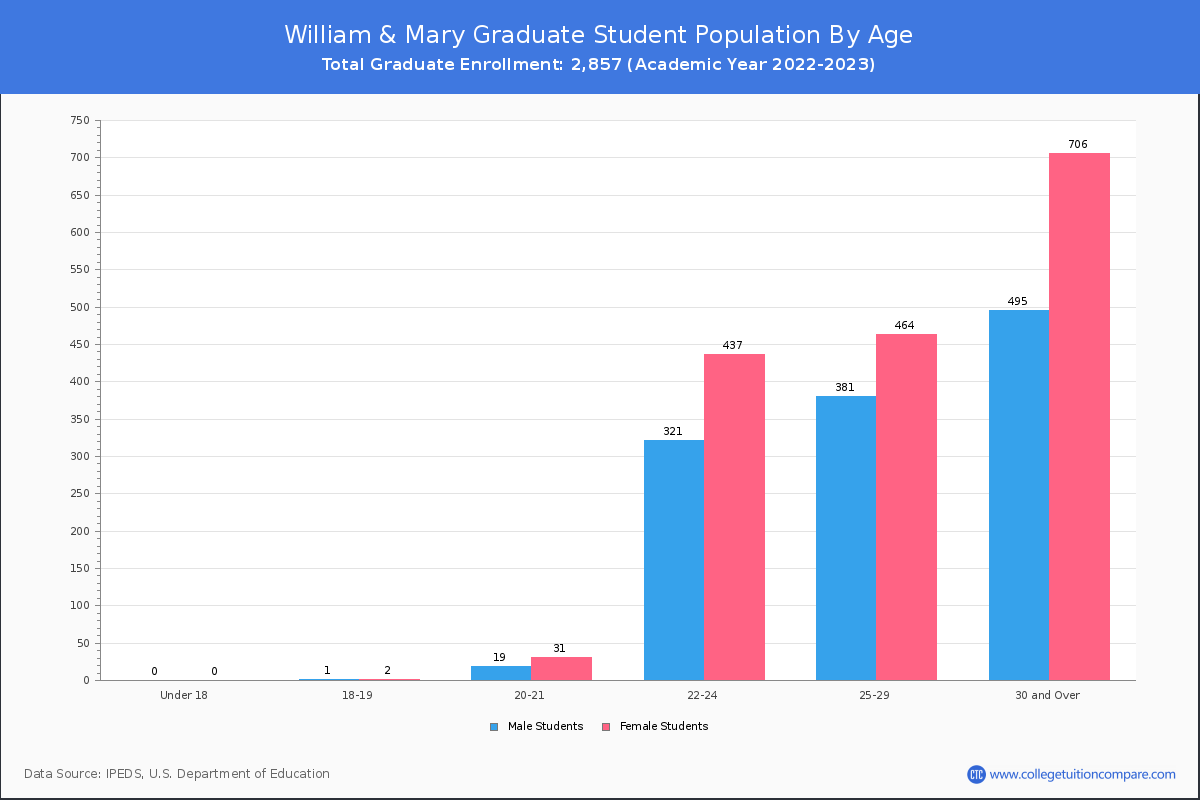
Student Age Distribution
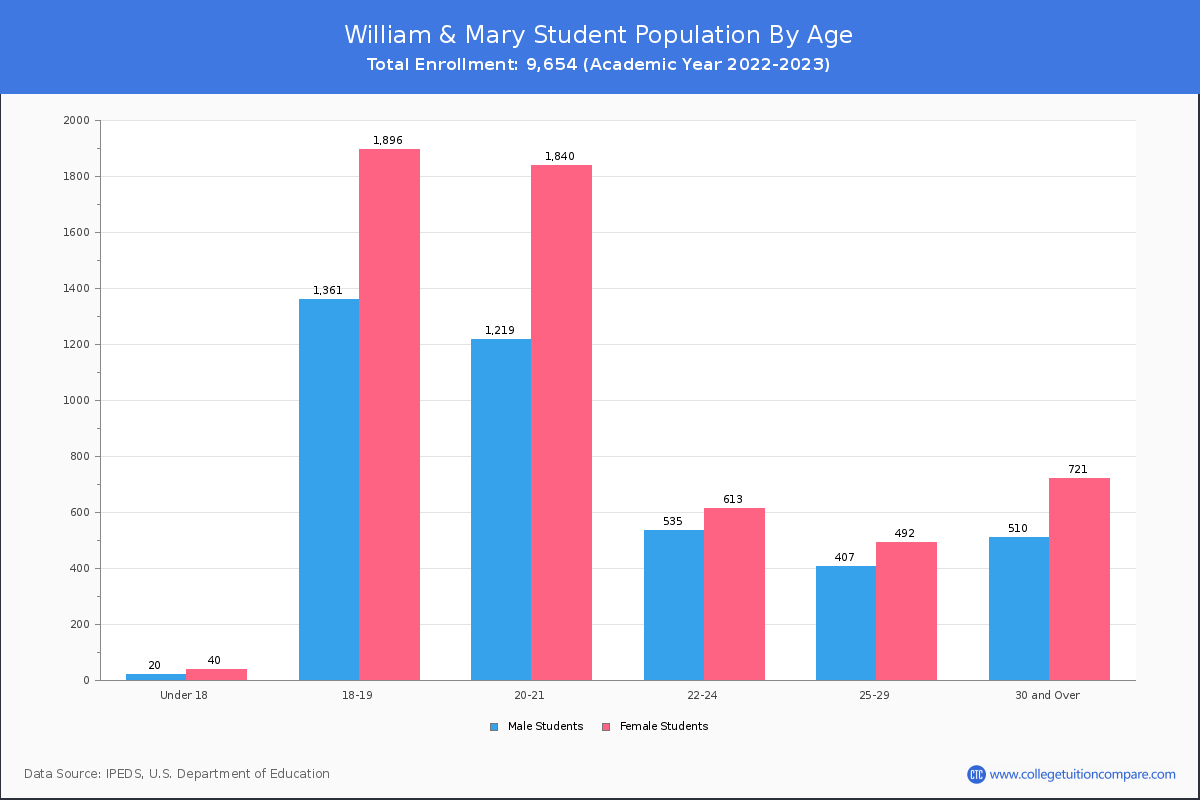
By age, W & M has 60 students under 18 years old and 8 students over 65 years old. There are 7,524 students under 25 years old, and 2,130 students over 25 years old out of 9,654 total students.
In undergraduate programs, 60 students are younger than 18 and 4 students are older than 65. W & M has 6,713 undergraduate students aged under 25 and 84 students aged 25 and over.
It has 811 graduate students aged under 25 and 2,046 students aged 25 and over.
| Age | Total | Men | Women |
|---|---|---|---|
| Under 18 | 60 | 40 | 20 |
| 18-19 | 3,257 | 1,896 | 1,361 |
| 20-21 | 3,059 | 1,840 | 1,219 |
| 22-24 | 1,148 | 613 | 535 |
| 25-29 | 899 | 492 | 407 |
| 30-34 | 437 | 240 | 197 |
| 35-39 | 298 | 165 | 133 |
| 40-49 | 349 | 222 | 127 |
| 50-64 | 139 | 91 | 48 |
| Over 65 | 8 | 3 | 5 |
| Age | Total | Men | Women |
|---|---|---|---|
| Under 18 | 60 | 40 | 20 |
| 18-19 | 3,254 | 1,894 | 1,360 |
| 20-21 | 3,009 | 1,809 | 1,200 |
| 22-24 | 390 | 176 | 214 |
| 25-29 | 54 | 28 | 26 |
| 30-34 | 13 | 5 | 8 |
| 35-39 | 6 | 3 | 3 |
| 40-49 | 5 | 3 | 2 |
| 50-64 | 2 | 2 | 0 |
| Over 65 | 4 | 2 | 2 |
| Age | Total | Men | Women |
|---|
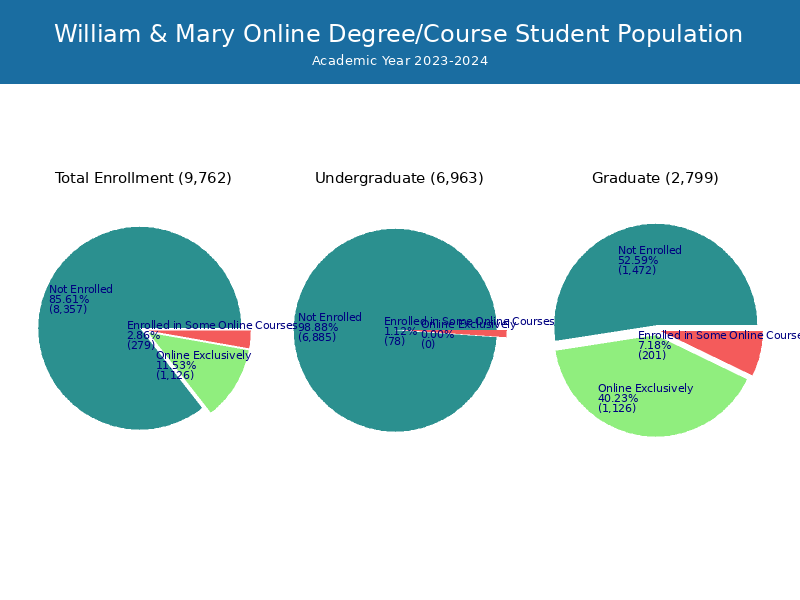
Online Student Enrollment
Distance learning, also called online education, is very attractive to students, especially who want to continue education and work in field. At William & Mary, 1,042 students are enrolled exclusively in online courses and 386 students are enrolled in some online courses.
635 students lived in Virginia or jurisdiction in which the school is located are enrolled exclusively in online courses and 407 students live in other State or outside of the United States.
| All Students | Enrolled Exclusively Online Courses | Enrolled in Some Online Courses | |
|---|---|---|---|
| All Students | 9,654 | 1,042 | 386 |
| Undergraduate | 6,797 | 3 | 175 |
| Graduate | 2,857 | 1,039 | 211 |
| Virginia Residents | Other States in U.S. | Outside of U.S. | |
|---|---|---|---|
| All Students | 635 | 400 | 7 |
| Undergraduate | 3 | - | 0 |
| Graduate | 632 | 400 | 7 |
Transfer-in Students (Undergraduate)
Among 6,797 enrolled in undergraduate programs, 155 students have transferred-in from other institutions. The percentage of transfer-in students is 2.28%.153 students have transferred in as full-time status and 2 students transferred in as part-time status.
| Number of Students | |
|---|---|
| Regular Full-time | 6,563 |
| Transfer-in Full-time | 153 |
| Regular Part-time | 79 |
| Transfer-in Part-time | 2 |