Student Population by Gender
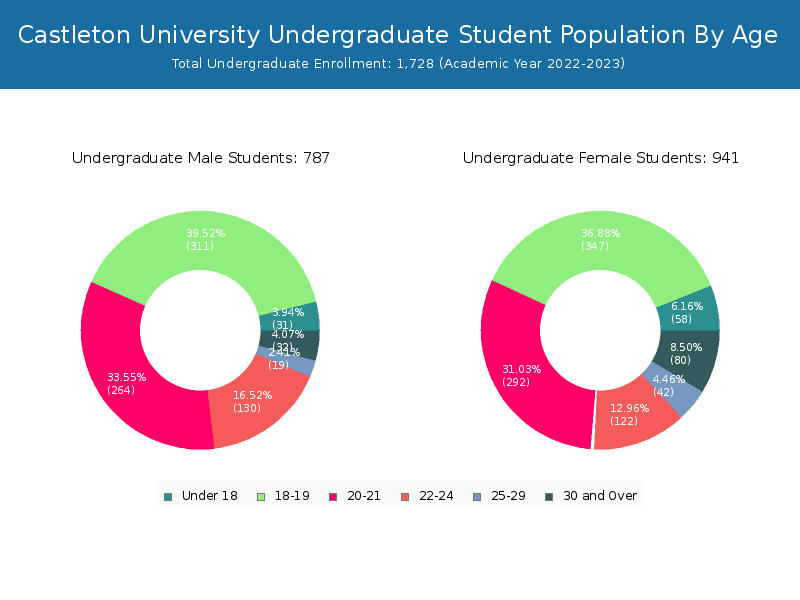
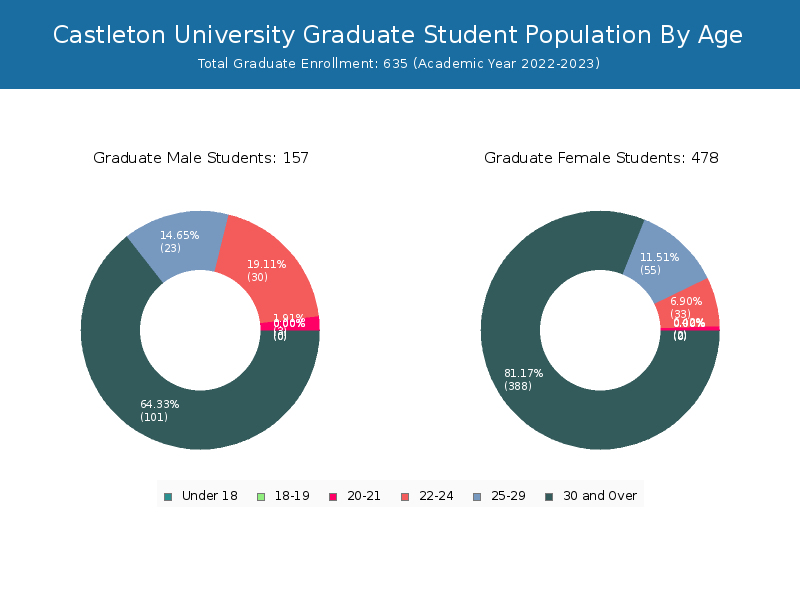
Castleton University has a total of 2,363 enrolled students for the academic year 2022-2023. 1,728 students have enrolled in undergraduate programs and 635 students joined graduate programs.
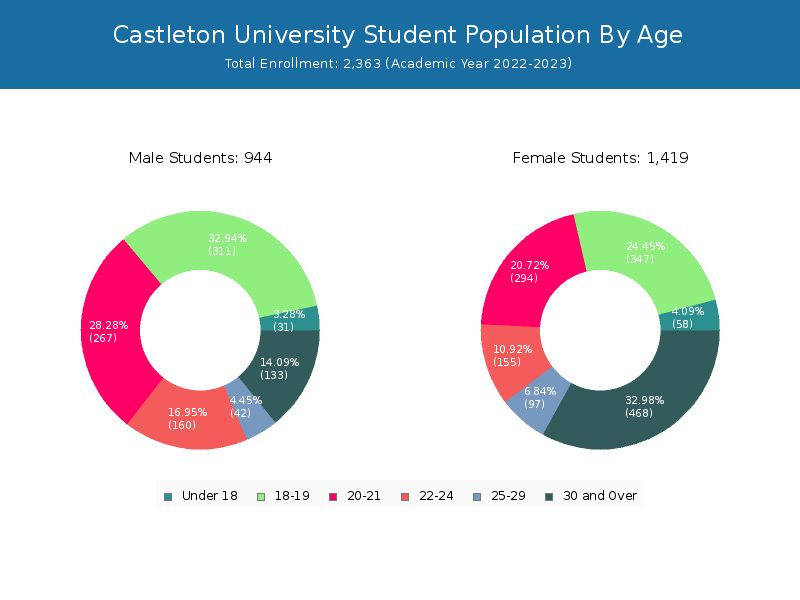
By gender, 944 male and 1,419 female students (the male-female ratio is 40:60) are attending the school. The gender distribution is based on the 2022-2023 data.
| Total | Undergraduate | Graduate | |
|---|---|---|---|
| Total | 2,363 | 1,728 | 635 |
| Men | 944 | 787 | 157 |
| Women | 1,419 | 941 | 478 |
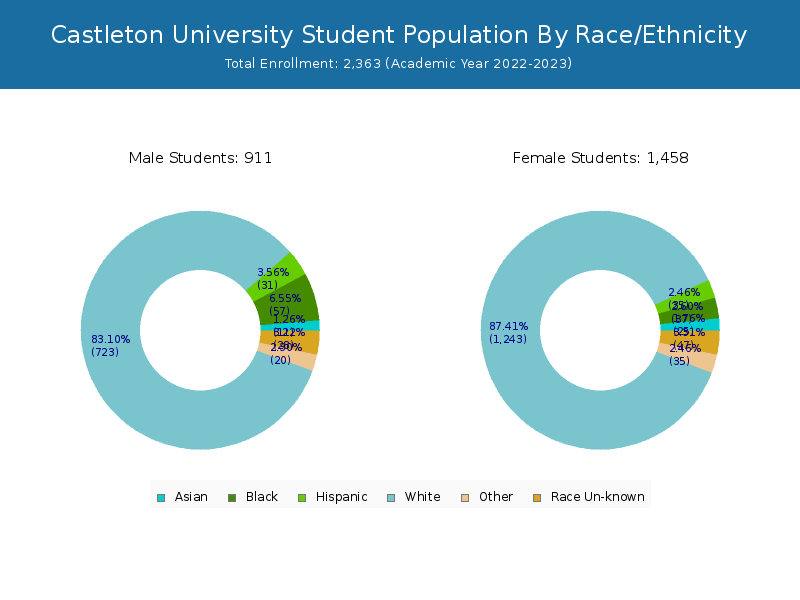
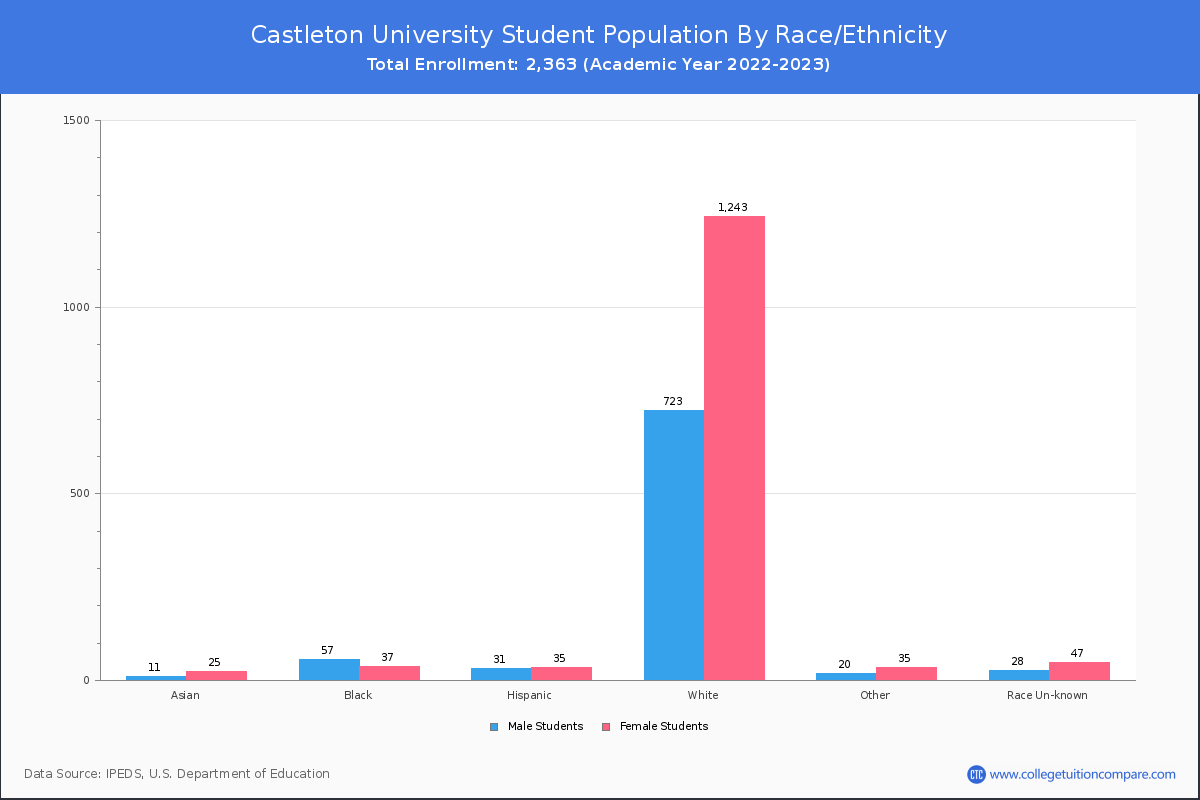
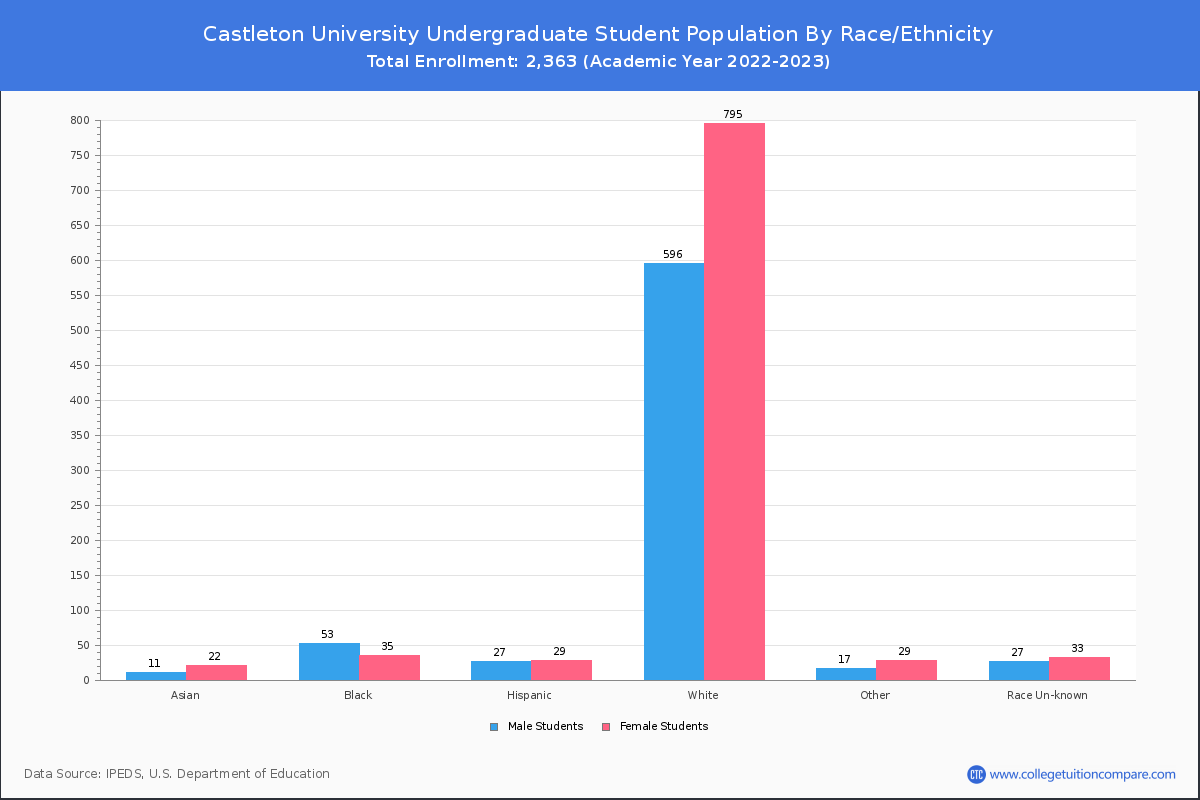
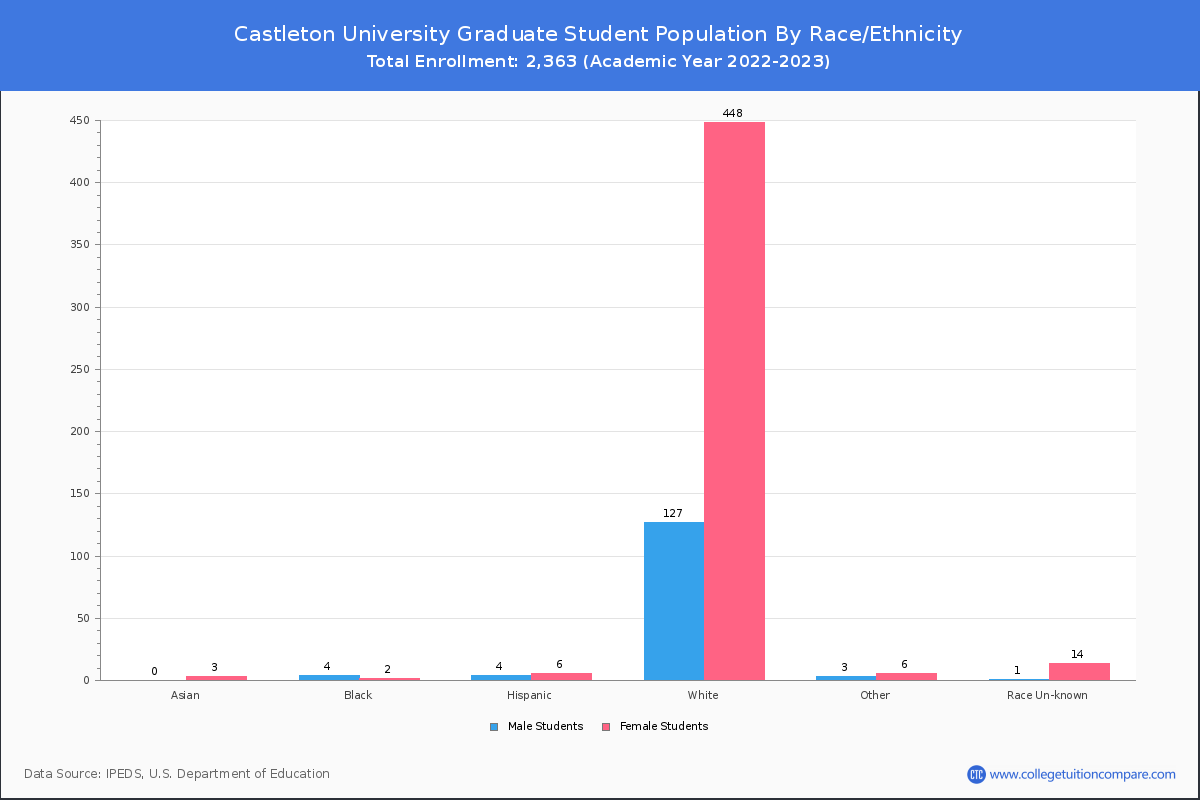
Student Distribution by Race/Ethnicity
By race/ethnicity, 1,941 White, 85 Black, and 32 Asian students out of a total of 2,363 are attending at Castleton University. Comprehensive enrollment statistic data by race/ethnicity is shown in the next chart (Academic year 2022-2023 data).
| Race | Total | Men | Women |
|---|---|---|---|
| American Indian or Native American | 12 | 4 | 8 |
| Asian | 32 | 12 | 20 |
| Black | 85 | 53 | 32 |
| Hispanic | 83 | 51 | 32 |
| Native Hawaiian or Other Pacific Islanders | 0 | 0 | 0 |
| White | 1,941 | 725 | 1,216 |
| Two or more races | 50 | 22 | 28 |
| Race Unknown | 71 | 30 | 41 |
| Race | Total | Men | Women |
|---|---|---|---|
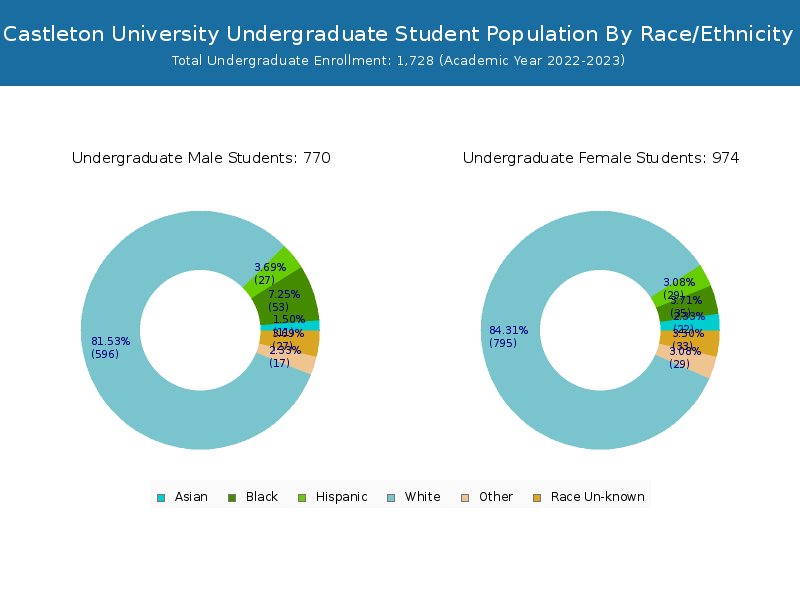
| American Indian or Native American | 7 | 2 | 5 |
| Asian | 28 | 11 | 17 |
| Black | 73 | 46 | 27 |
| Hispanic | 64 | 41 | 23 |
| Native Hawaiian or Other Pacific Islanders | 0 | 0 | 0 |
| White | 1,372 | 596 | 776 |
| Two or more races | 41 | 16 | 25 |
| Race Unknown | 59 | 28 | 31 |
| Race | Total | Men | Women |
|---|---|---|---|
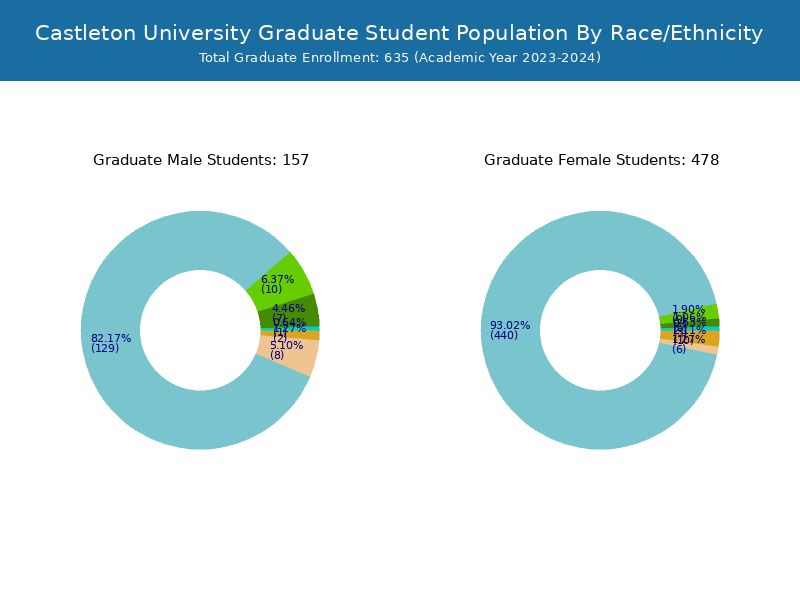
| American Indian or Native American | 1 | 0 | 1 |
| Asian | 1 | 0 | 1 |
| Black | 2 | 1 | 1 |
| Hispanic | 2 | 1 | 1 |
| Native Hawaiian or Other Pacific Islanders | 0 | 0 | 0 |
| White | 92 | 42 | 50 |
| Two or more races | 1 | 1 | 0 |
| Race Unknown | 1 | 0 | 1 |
Student Age Distribution
By age, Castleton has 89 students under 18 years old and 15 students over 65 years old. There are 1,623 students under 25 years old, and 740 students over 25 years old out of 2,363 total students.
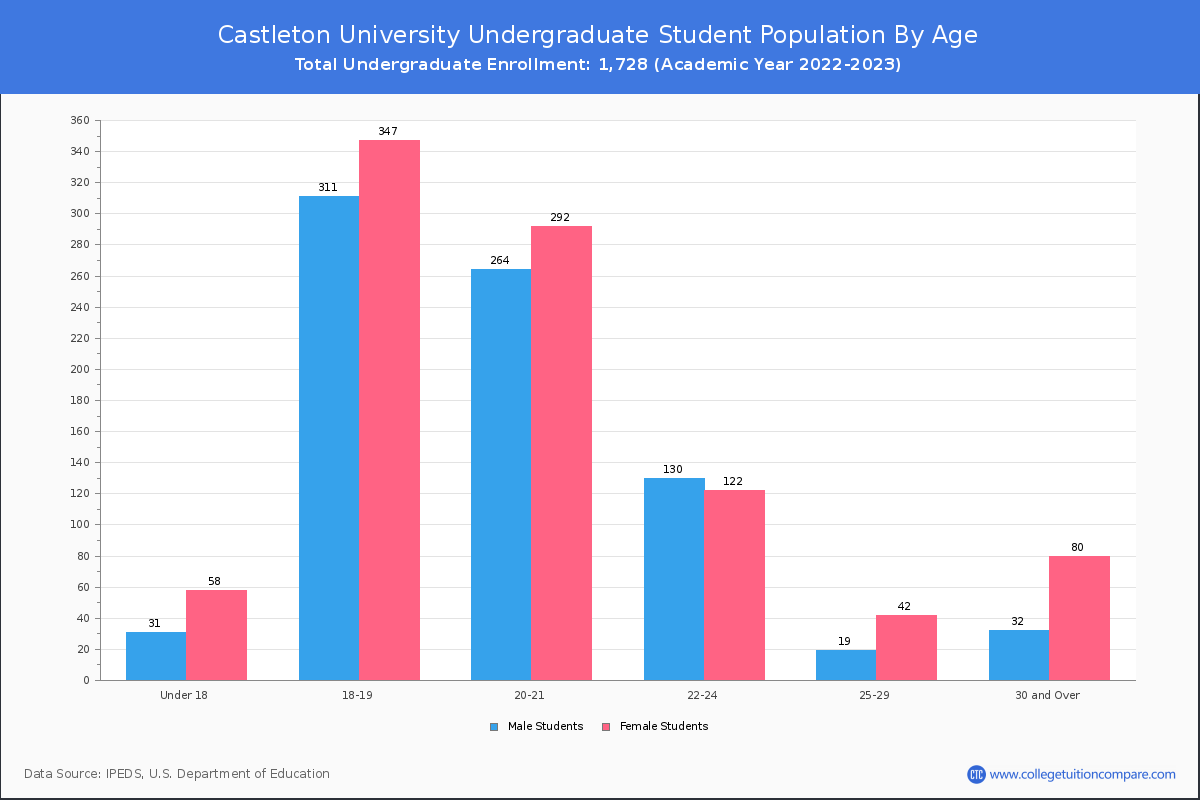
In undergraduate programs, 89 students are younger than 18 and 4 students are older than 65. Castleton has 1,555 undergraduate students aged under 25 and 173 students aged 25 and over.
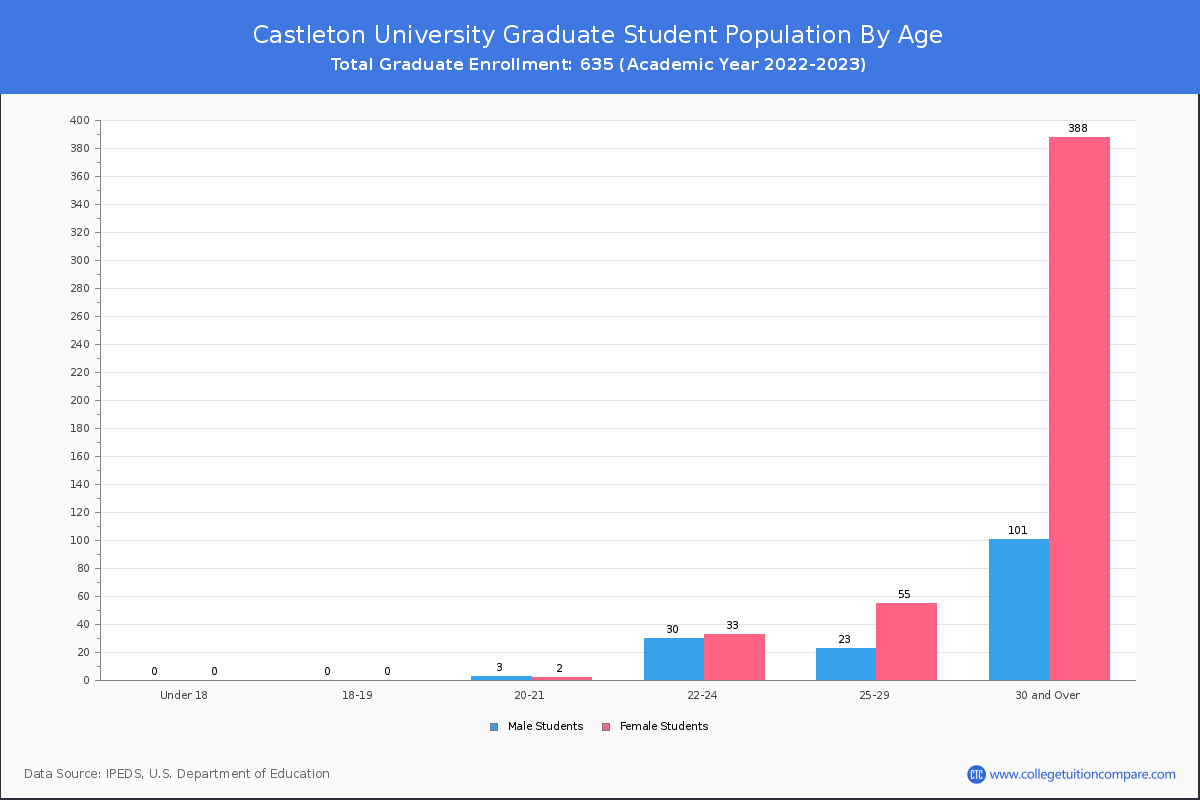
It has 68 graduate students aged under 25 and 567 students aged 25 and over.
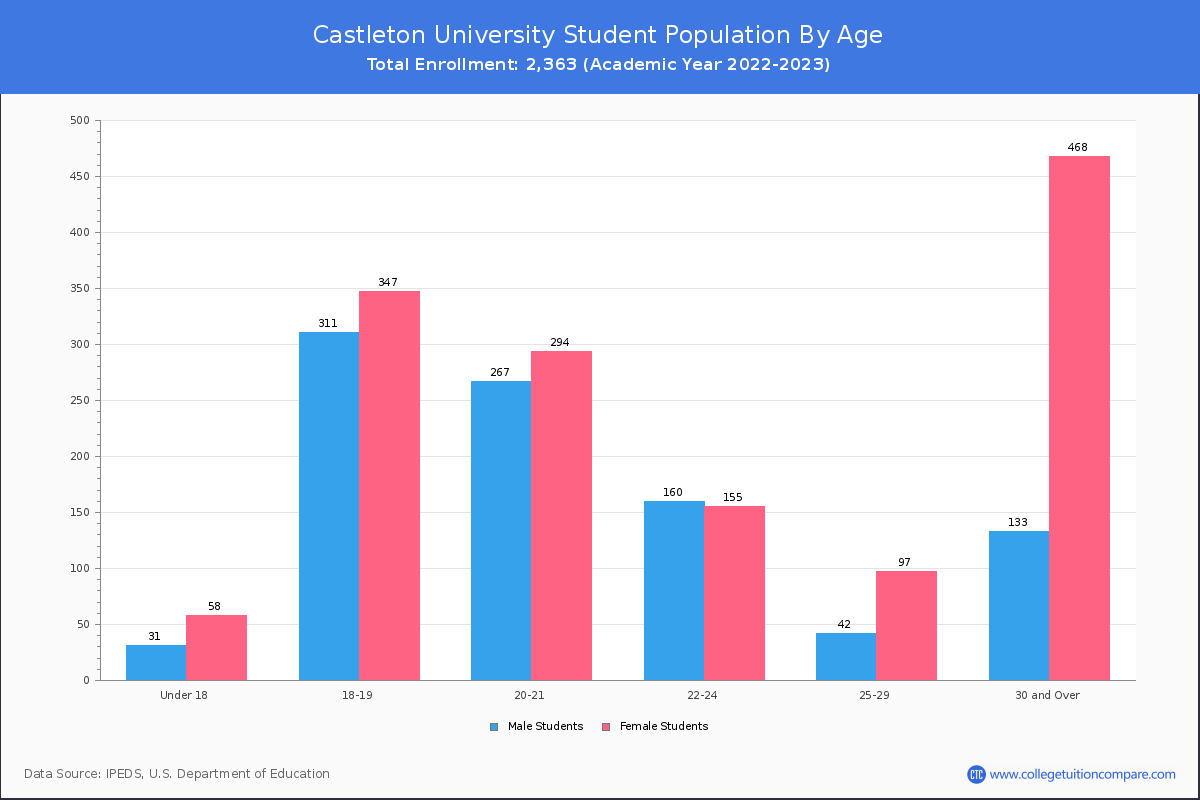
| Age | Total | Men | Women |
|---|---|---|---|
| Under 18 | 89 | 58 | 31 |
| 18-19 | 658 | 347 | 311 |
| 20-21 | 561 | 294 | 267 |
| 22-24 | 315 | 155 | 160 |
| 25-29 | 139 | 97 | 42 |
| 30-34 | 113 | 94 | 19 |
| 35-39 | 115 | 85 | 30 |
| 40-49 | 203 | 155 | 48 |
| 50-64 | 155 | 119 | 36 |
| Over 65 | 15 | 15 | 0 |
| Age | Total | Men | Women |
|---|---|---|---|
| Under 18 | 89 | 58 | 31 |
| 18-19 | 658 | 347 | 311 |
| 20-21 | 556 | 292 | 264 |
| 22-24 | 252 | 122 | 130 |
| 25-29 | 61 | 42 | 19 |
| 30-34 | 42 | 34 | 8 |
| 35-39 | 16 | 10 | 6 |
| 40-49 | 32 | 21 | 11 |
| 50-64 | 18 | 11 | 7 |
| Over 65 | 4 | 4 | 0 |
| Age | Total | Men | Women |
|---|
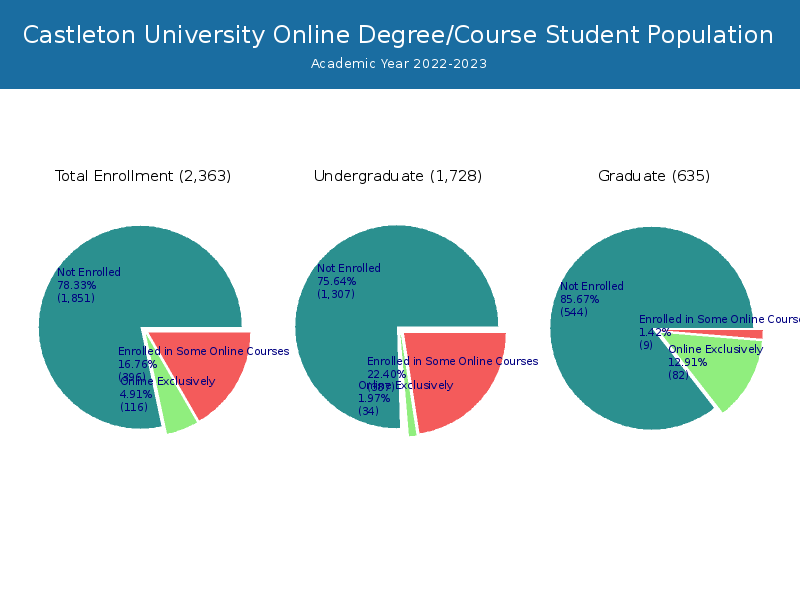
Online Student Enrollment
Distance learning, also called online education, is very attractive to students, especially who want to continue education and work in field. At Castleton University, 116 students are enrolled exclusively in online courses and 396 students are enrolled in some online courses.
72 students lived in Vermont or jurisdiction in which the school is located are enrolled exclusively in online courses and 44 students live in other State or outside of the United States.
| All Students | Enrolled Exclusively Online Courses | Enrolled in Some Online Courses | |
|---|---|---|---|
| All Students | 2,363 | 116 | 396 |
| Undergraduate | 1,728 | 34 | 387 |
| Graduate | 635 | 82 | 9 |
| Vermont Residents | Other States in U.S. | Outside of U.S. | |
|---|---|---|---|
| All Students | 72 | 44 | 0 |
| Undergraduate | 26 | 8 | 0 |
| Graduate | 46 | 36 | 0 |
Transfer-in Students (Undergraduate)
Among 1,728 enrolled in undergraduate programs, 107 students have transferred-in from other institutions. The percentage of transfer-in students is 6.19%.100 students have transferred in as full-time status and 7 students transferred in as part-time status.
| Number of Students | |
|---|---|
| Regular Full-time | 1,361 |
| Transfer-in Full-time | 100 |
| Regular Part-time | 260 |
| Transfer-in Part-time | 7 |