Student Population by Gender
Southwestern University has a total of 1,483 enrolled students for the academic year 2022-2023. All 1,483 students are enrolled into undergraduate programs.
By gender, 685 male and 798 female students (the male-female ratio is 46:54) are attending the school. The gender distribution is based on the 2022-2023 data.
| Undergraduate | |
|---|---|
| Total | 1,483 |
| Men | 685 |
| Women | 798 |
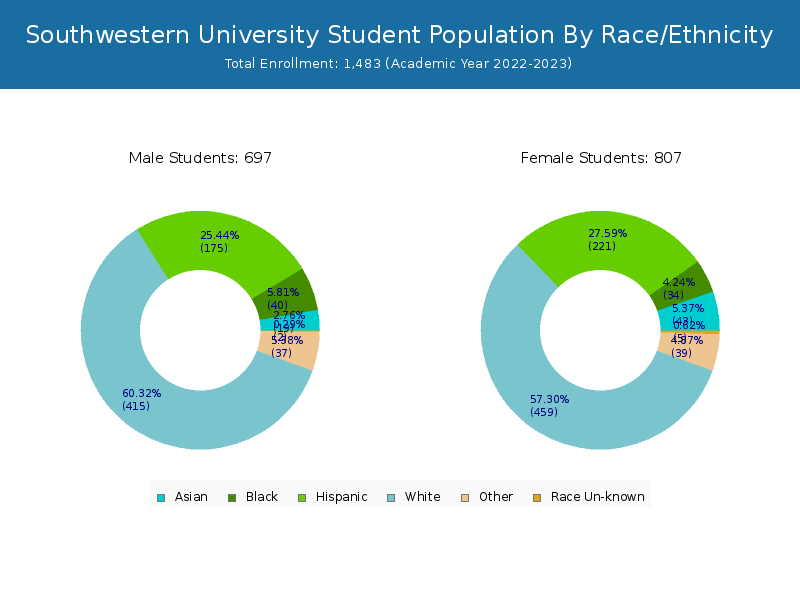
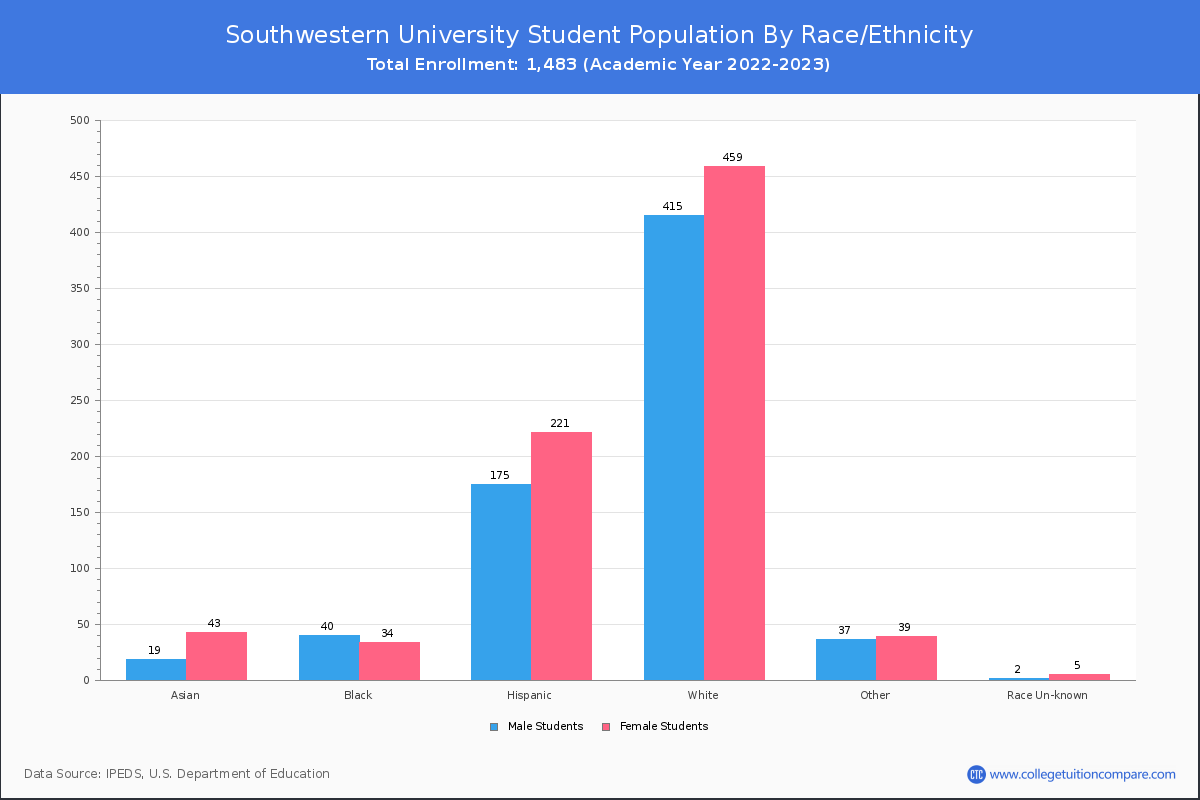
Student Distribution by Race/Ethnicity
By race/ethnicity, 829 White, 82 Black, and 60 Asian students out of a total of 1,483 are attending at Southwestern University. Comprehensive enrollment statistic data by race/ethnicity is shown in the next chart (Academic year 2022-2023 data).
| Race | Total | Men | Women |
|---|---|---|---|
| American Indian or Native American | 4 | 3 | 1 |
| Asian | 60 | 24 | 36 |
| Black | 82 | 45 | 37 |
| Hispanic | 397 | 170 | 227 |
| Native Hawaiian or Other Pacific Islanders | 1 | 1 | 0 |
| White | 829 | 393 | 436 |
| Two or more races | 73 | 33 | 40 |
| Race Unknown | 10 | 3 | 7 |
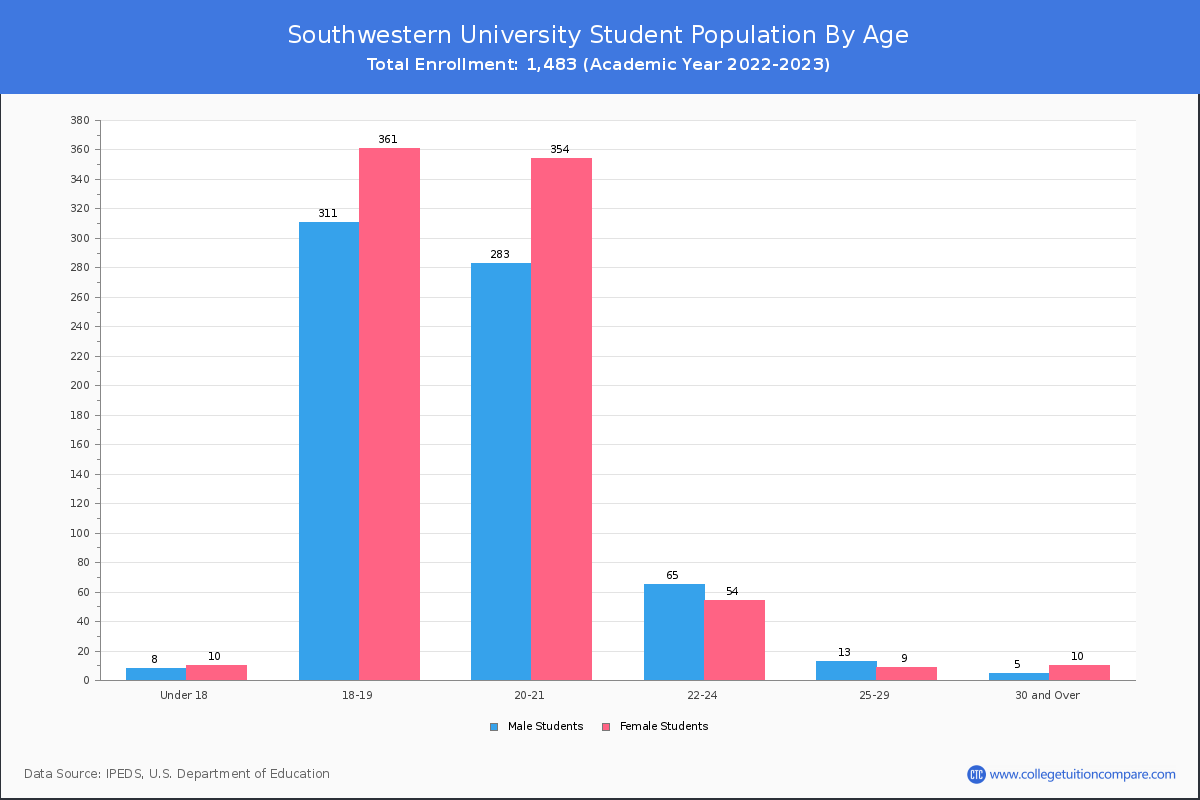
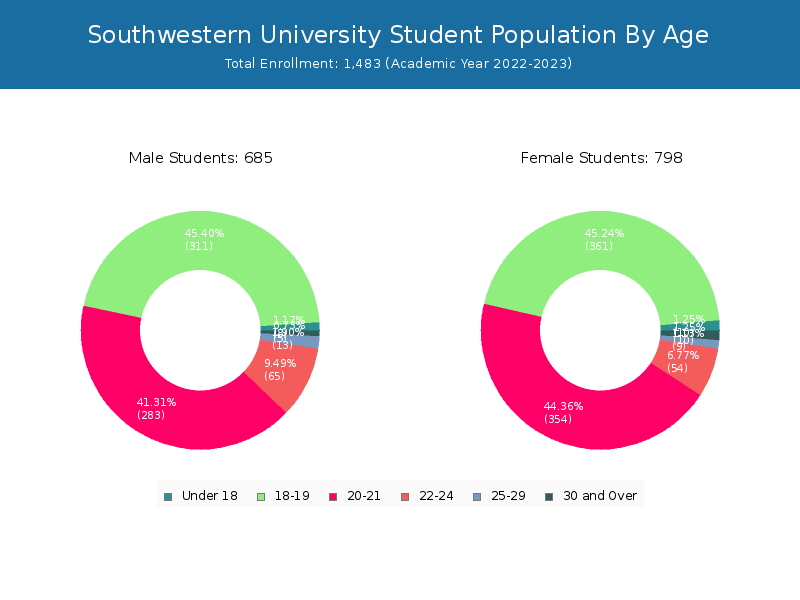
Student Age Distribution
There are 1,446 students under 25 years old, and 37 students over 25 years old out of 1,483 total students.
| Age | Total | Men | Women |
|---|---|---|---|
| Under 18 | 18 | 10 | 8 |
| 18-19 | 672 | 361 | 311 |
| 20-21 | 637 | 354 | 283 |
| 22-24 | 119 | 54 | 65 |
| 25-29 | 22 | 9 | 13 |
| 30-34 | 6 | 3 | 3 |
| 35-39 | 6 | 4 | 2 |
| 40-49 | 1 | 1 | 0 |
| 50-64 | 2 | 2 | 0 |
Transfer-in Students (Undergraduate)
Among 1,483 enrolled in undergraduate programs, 37 students have transferred-in from other institutions. The percentage of transfer-in students is 2.49%.
| Number of Students | |
|---|---|
| Regular Full-time | 1,428 |
| Transfer-in Full-time | 37 |