Student Population by Gender
Vanderbilt University has a total of 13,710 enrolled students for the academic year 2022-2023. 7,151 students have enrolled in undergraduate programs and 6,559 students joined graduate programs.
By gender, 6,047 male and 7,663 female students (the male-female ratio is 44:56) are attending the school. The gender distribution is based on the 2022-2023 data.
| Total | Undergraduate | Graduate | |
|---|---|---|---|
| Total | 13,710 | 7,151 | 6,559 |
| Men | 6,047 | 3,443 | 2,604 |
| Women | 7,663 | 3,708 | 3,955 |
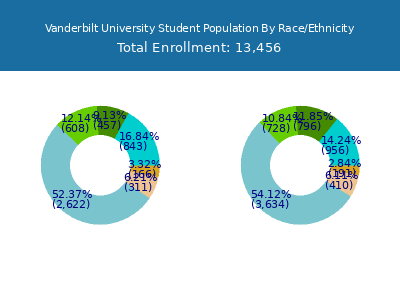
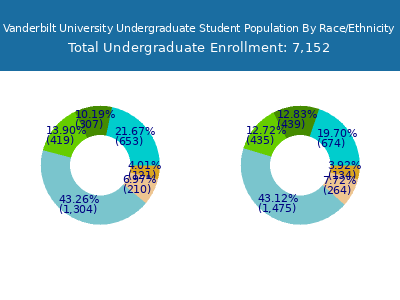
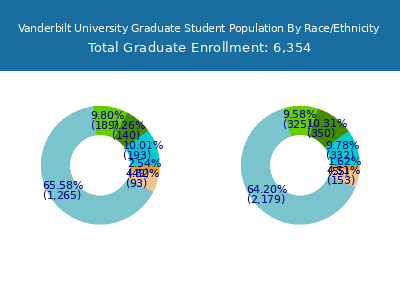
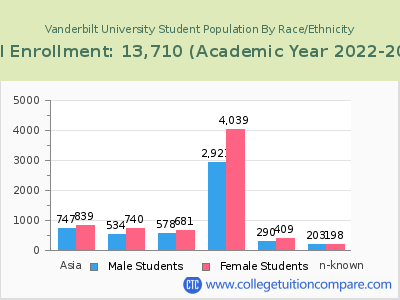
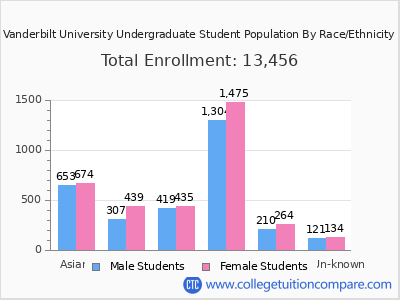
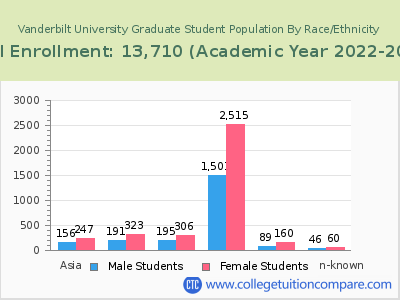
Student Distribution by Race/Ethnicity
| Race | Total | Men | Women |
|---|---|---|---|
| American Indian or Native American | 44 | 14 | 30 |
| Asian | 1,698 | 778 | 920 |
| Black | 1,269 | 497 | 772 |
| Hispanic | 1,279 | 576 | 703 |
| Native Hawaiian or Other Pacific Islanders | 28 | 15 | 13 |
| White | 6,658 | 2,796 | 3,862 |
| Two or more races | 643 | 274 | 369 |
| Race Unknown | 377 | 191 | 186 |
| Race | Total | Men | Women |
|---|---|---|---|
| American Indian or Native American | 29 | 9 | 20 |
| Asian | 1,250 | 604 | 646 |
| Black | 743 | 316 | 427 |
| Hispanic | 787 | 386 | 401 |
| Native Hawaiian or Other Pacific Islanders | 21 | 12 | 9 |
| White | 2,904 | 1,391 | 1,513 |
| Two or more races | 412 | 185 | 227 |
| Race Unknown | 276 | 146 | 130 |
| Race | Total | Men | Women |
|---|---|---|---|
| American Indian or Native American | 0 | 0 | 0 |
| Asian | 44 | 23 | 21 |
| Black | 5 | 0 | 5 |
| Hispanic | 27 | 13 | 14 |
| Native Hawaiian or Other Pacific Islanders | 0 | 0 | 0 |
| White | 113 | 49 | 64 |
| Two or more races | 14 | 9 | 5 |
| Race Unknown | 4 | 4 | 0 |
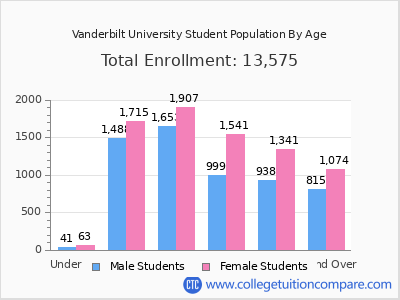
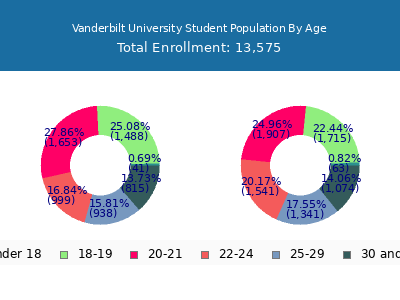
Student Age Distribution
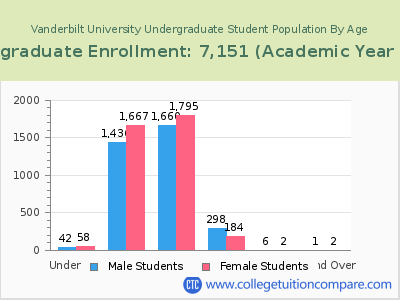
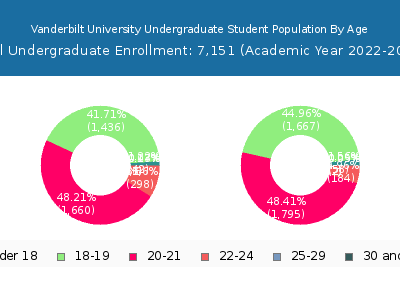
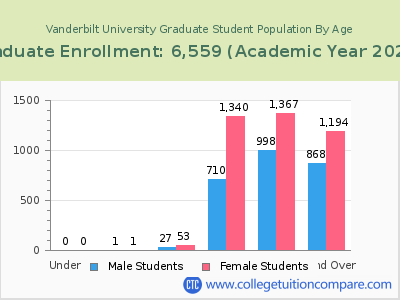
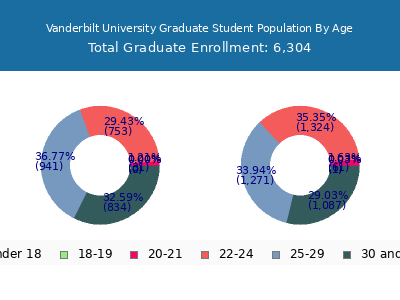
By age, Vanderbilt has 100 students under 18 years old and 9 students over 65 years old. There are 9,272 students under 25 years old, and 4,438 students over 25 years old out of 13,710 total students.
Vanderbilt has 7,140 undergraduate students aged under 25 and 11 students aged 25 and over.
It has 2,132 graduate students aged under 25 and 4,427 students aged 25 and over.
| Age | Total | Men | Women |
|---|---|---|---|
| Under 18 | 100 | 58 | 42 |
| 18-19 | 3,105 | 1,668 | 1,437 |
| 20-21 | 3,535 | 1,848 | 1,687 |
| 22-24 | 2,532 | 1,524 | 1,008 |
| 25-29 | 2,373 | 1,369 | 1,004 |
| 30-34 | 955 | 529 | 426 |
| 35-39 | 423 | 245 | 178 |
| 40-49 | 449 | 277 | 172 |
| 50-64 | 229 | 141 | 88 |
| Over 65 | 9 | 4 | 5 |
| Age | Total | Men | Women |
|---|---|---|---|
| Under 18 | 100 | 58 | 42 |
| 18-19 | 3,103 | 1,667 | 1,436 |
| 20-21 | 3,455 | 1,795 | 1,660 |
| 22-24 | 482 | 184 | 298 |
| 25-29 | 8 | 2 | 6 |
| 30-34 | 1 | 0 | 1 |
| 35-39 | 1 | 1 | 0 |
| 40-49 | 1 | 1 | 0 |
| Age | Total | Men | Women |
|---|
Online Student Enrollment
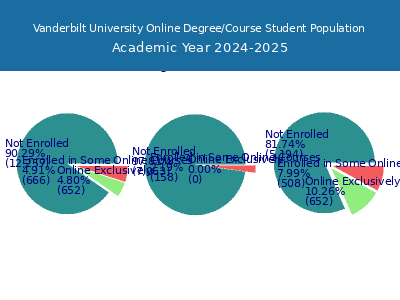
Distance learning, also called online education, is very attractive to students, especially who want to continue education and work in field. At Vanderbilt University, 699 students are enrolled exclusively in online courses and 618 students are enrolled in some online courses.
78 students lived in Tennessee or jurisdiction in which the school is located are enrolled exclusively in online courses and 621 students live in other State or outside of the United States.
| All Students | Enrolled Exclusively Online Courses | Enrolled in Some Online Courses | |
|---|---|---|---|
| All Students | 13,710 | 699 | 618 |
| Undergraduate | 7,151 | 0 | 0 |
| Graduate | 6,559 | 699 | 618 |
| Tennessee Residents | Other States in U.S. | Outside of U.S. | |
|---|---|---|---|
| All Students | 78 | 619 | 2 |
| Undergraduate | 0 | - | 0 |
| Graduate | 78 | 619 | 2 |
Transfer-in Students (Undergraduate)
Among 7,151 enrolled in undergraduate programs, 243 students have transferred-in from other institutions. The percentage of transfer-in students is 3.40%.242 students have transferred in as full-time status and 1 students transferred in as part-time status.
| Number of Students | |
|---|---|
| Regular Full-time | 6,840 |
| Transfer-in Full-time | 242 |
| Regular Part-time | 68 |
| Transfer-in Part-time | 1 |
